- Home
- /
- Exploring Qlik Cloud Analytics’ New Tabular Reporting Feature
By Maris Svilans, Infotrust

A few days back, Qlik Cloud Analytics introduced a new feature in its application named Tabular Reporting in Qlik Sense.
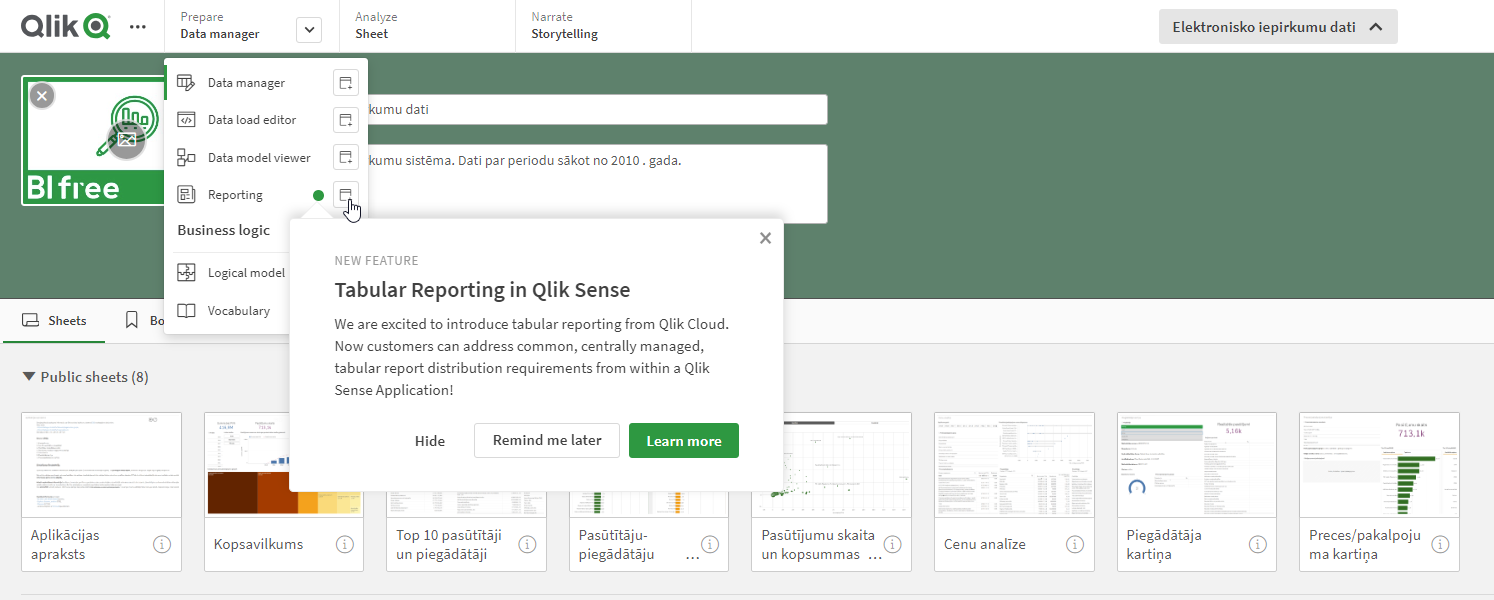
What does it do?
This feature allows us to automate the distribution of reports from any application, customizing these reports for different user groups.
It is also bringing Qlik add-in to O365, empowering developers to create custom, well-formatted Excel documents utilizing data and visualizations from Qlik.
The real game-changer is the ability to integrate these reports with Governed Report Tasks. This integration allows for the ‘bursting’ or distribution of these reports, delivering recipient-specific data directly to any stakeholder. With the Qlik platform serving as the primary source, it solidifies its role as a cornerstone for business decision-making, providing a robust and dynamic framework for data analysis and reporting.
How does it work?
In Step 1, named “Prepare,” we initiate the process by setting up individual users or user groups, along with defining specific filters. These filters are critical as they determine how data will be selectively segmented and presented for each user or group.

In Step 2, we use Qlik plugin for Excel to design the report.
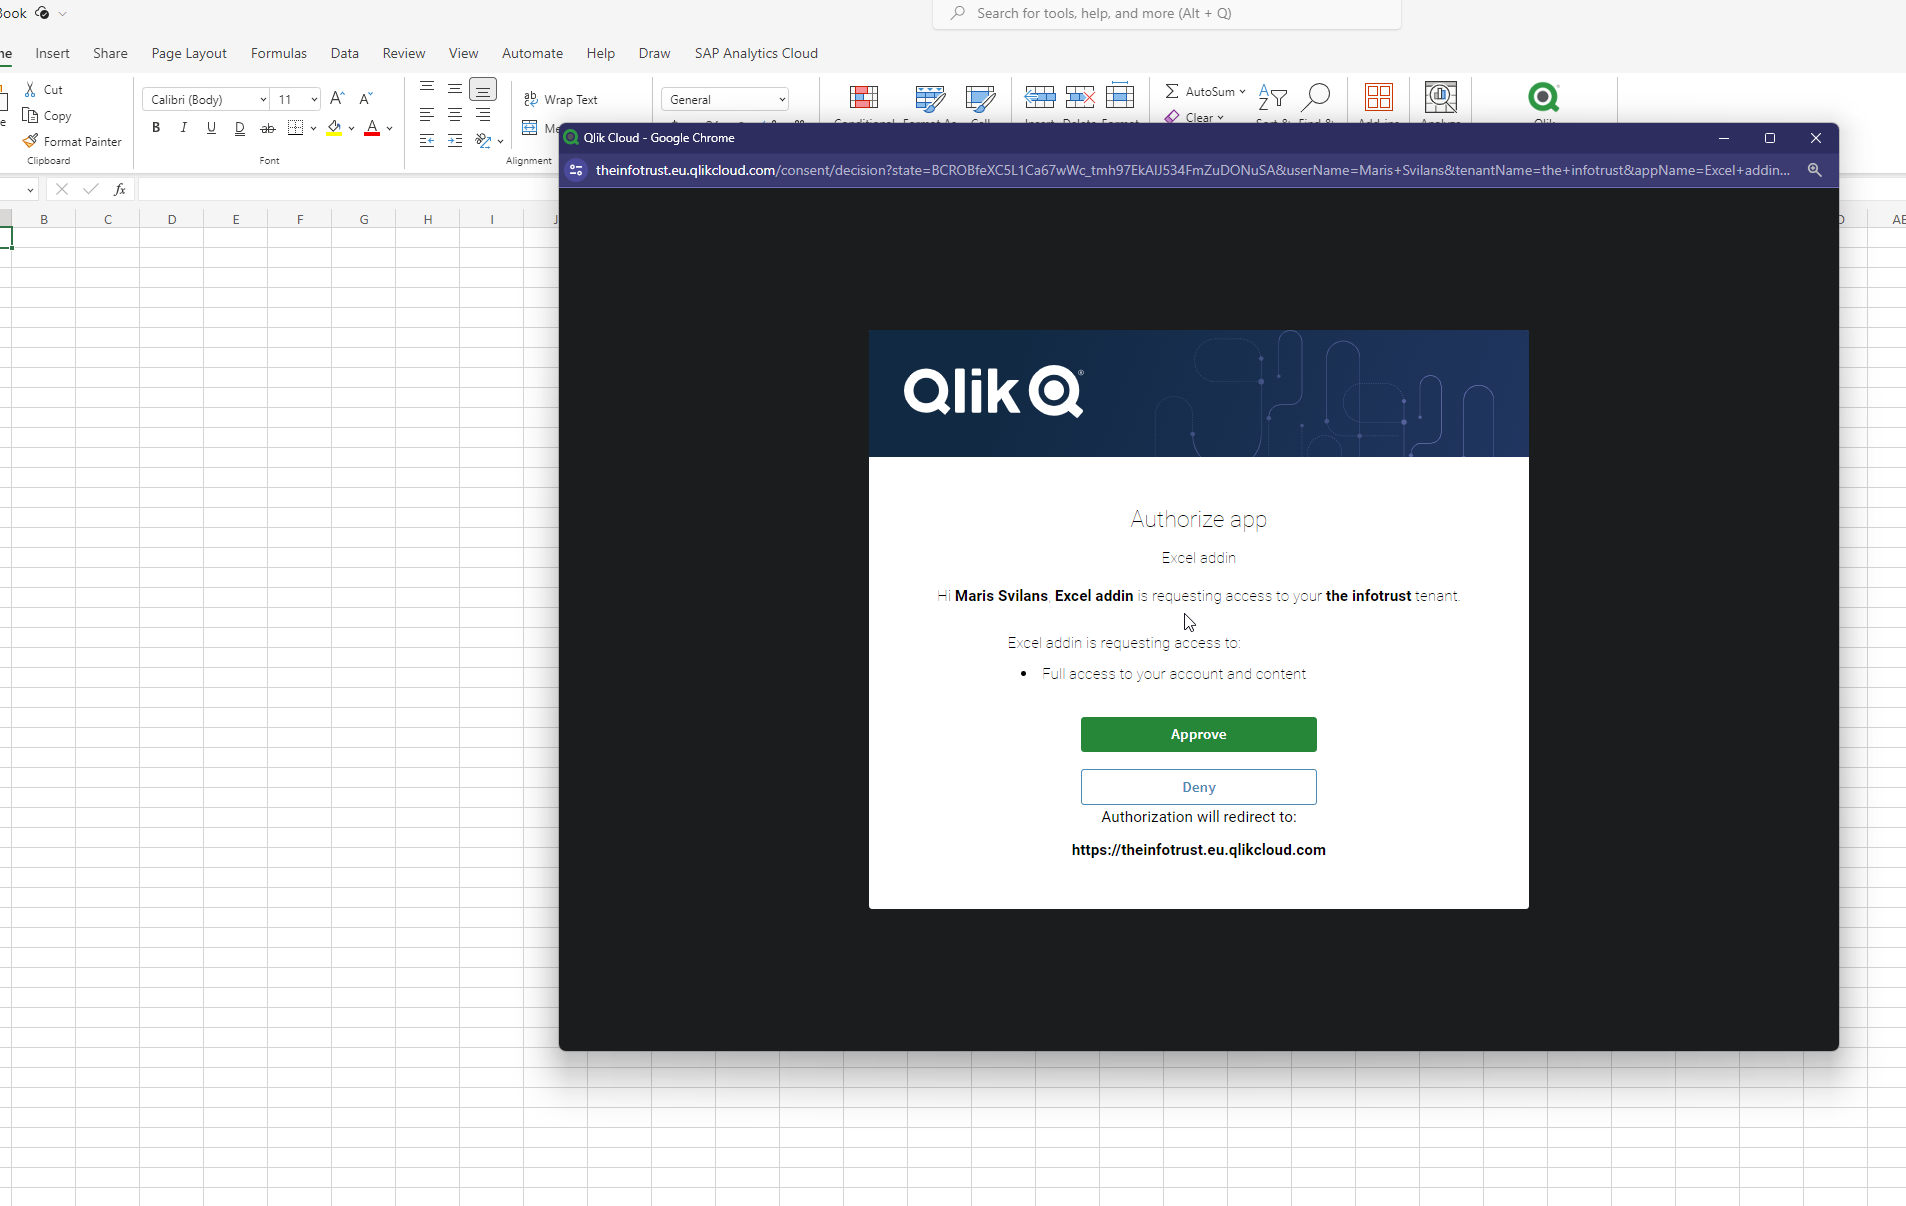
In O365, when activated, this plugin enables us to connect to any Qlik Cloud Analytics application and craft a “custom report” within Excel. This includes the incorporation of graphics (as images) and tables (using Excel’s native table functionality).
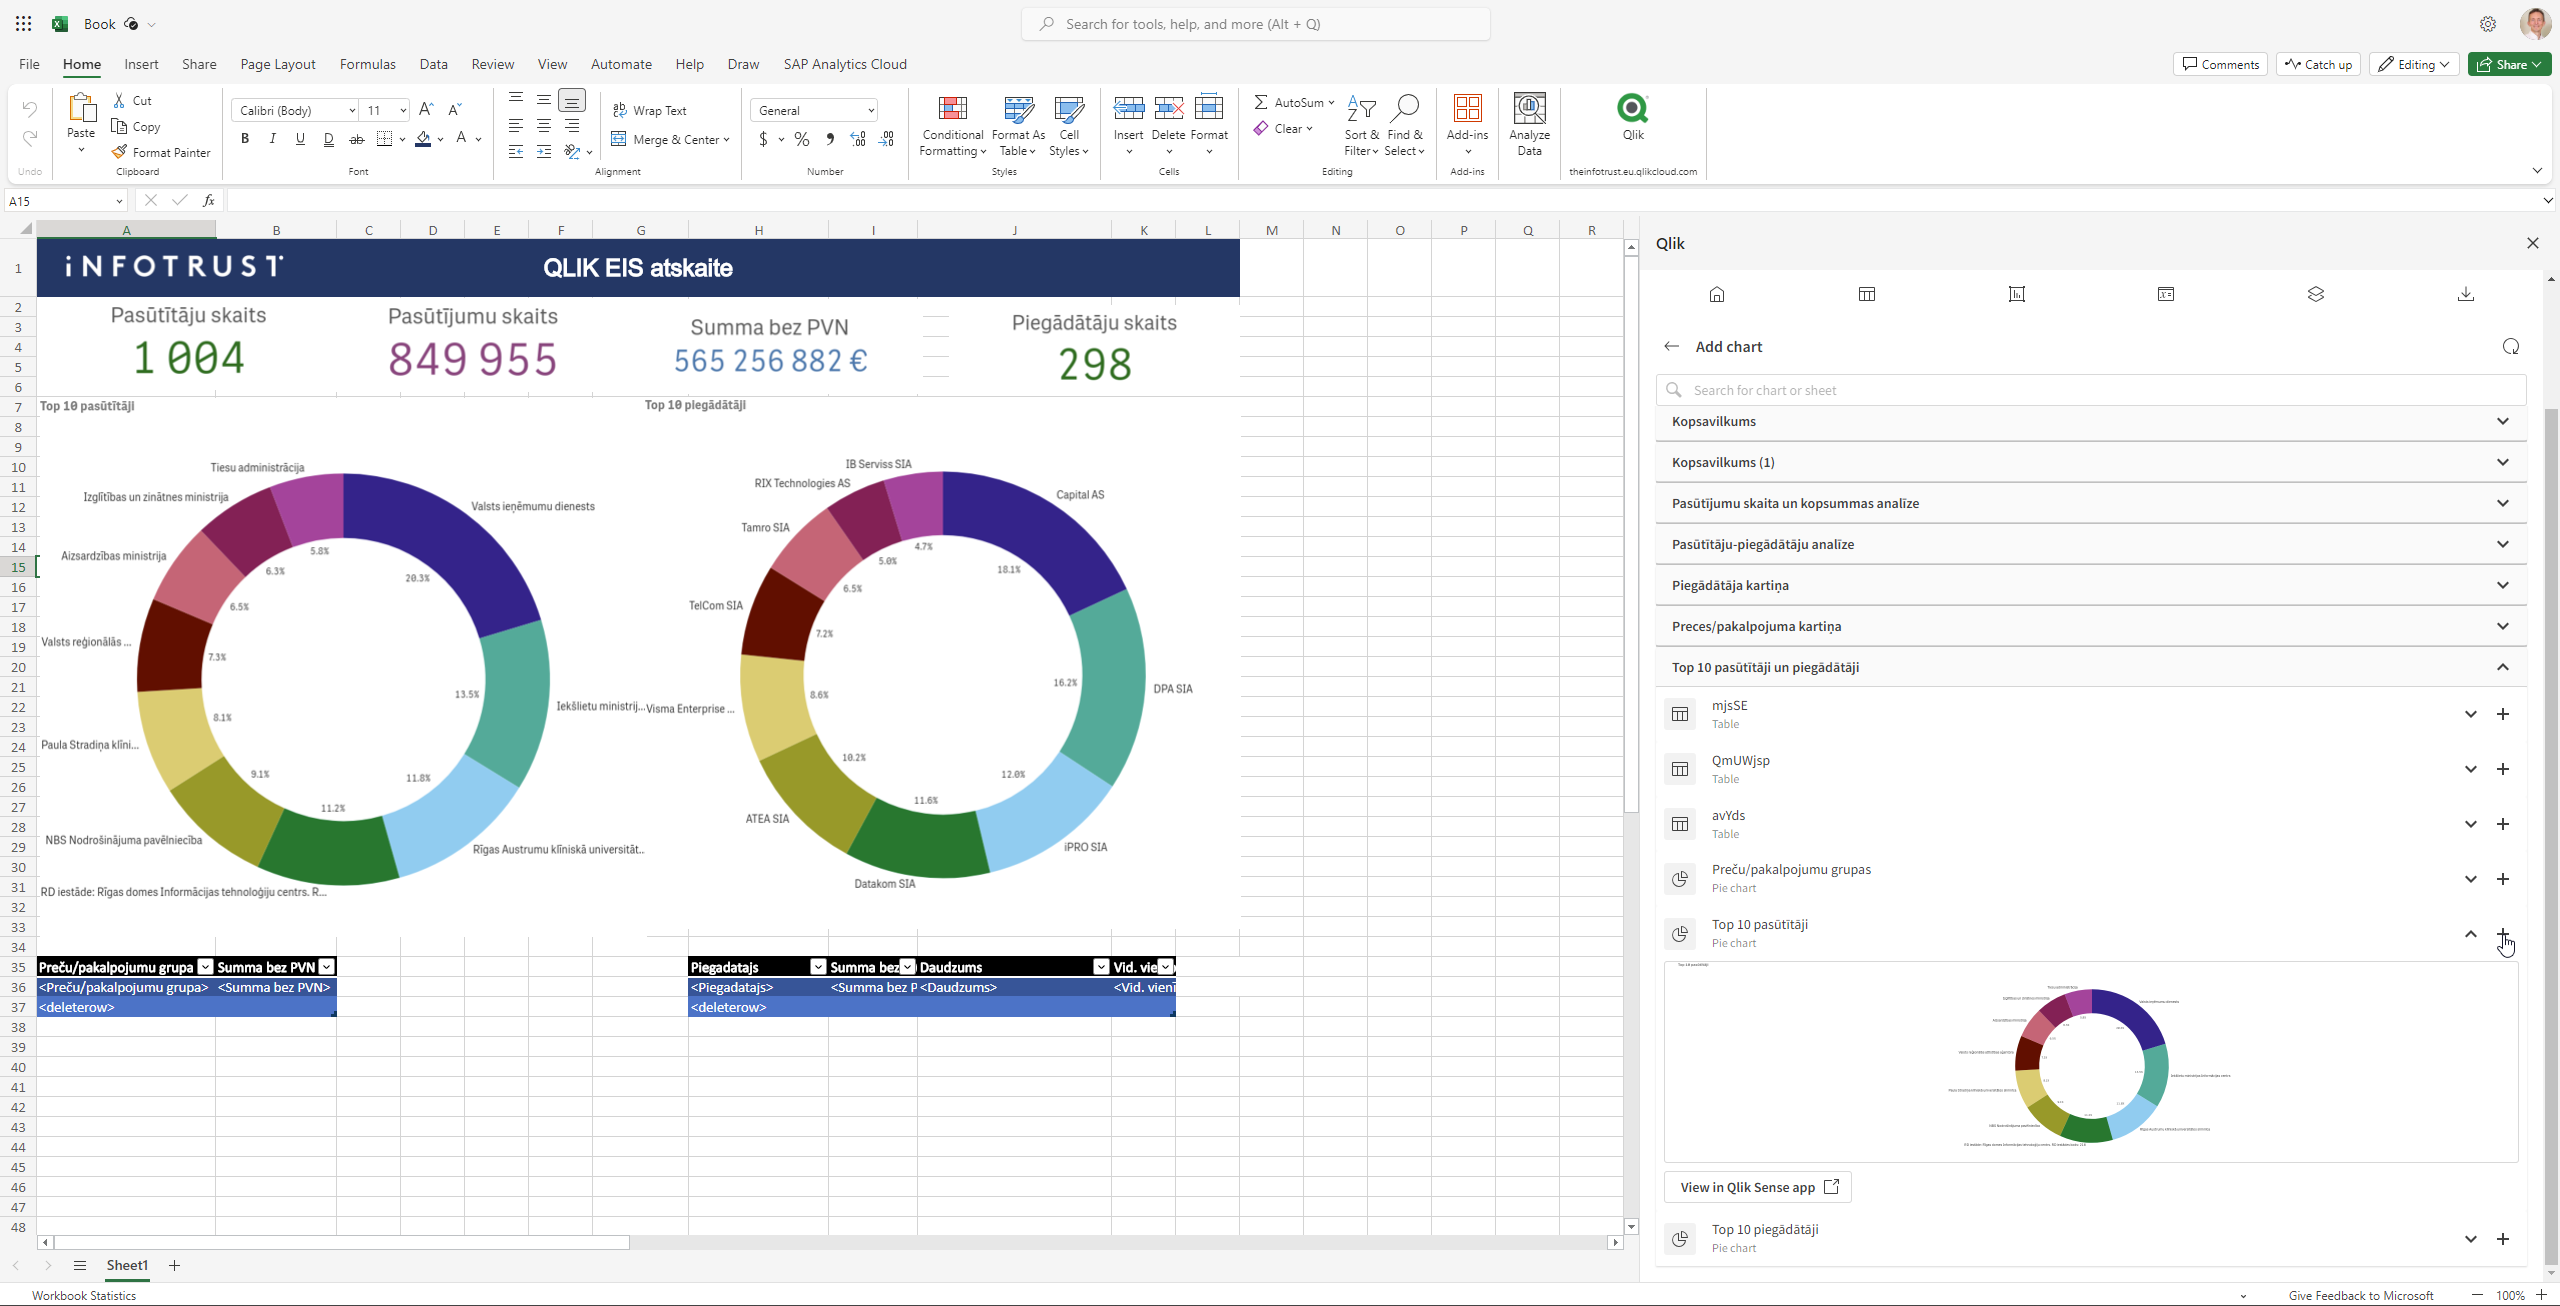
Users can arrange and format these elements as they prefer, even creating multiple Excel sheets with various levels of complexity. Once the report is finalized, the user saves this customized template and evaluates the outcome. This template can then be attached to our application.
Following this, we create a “Report Task” where we designate the report’s recipients, which could be individual users or groups.
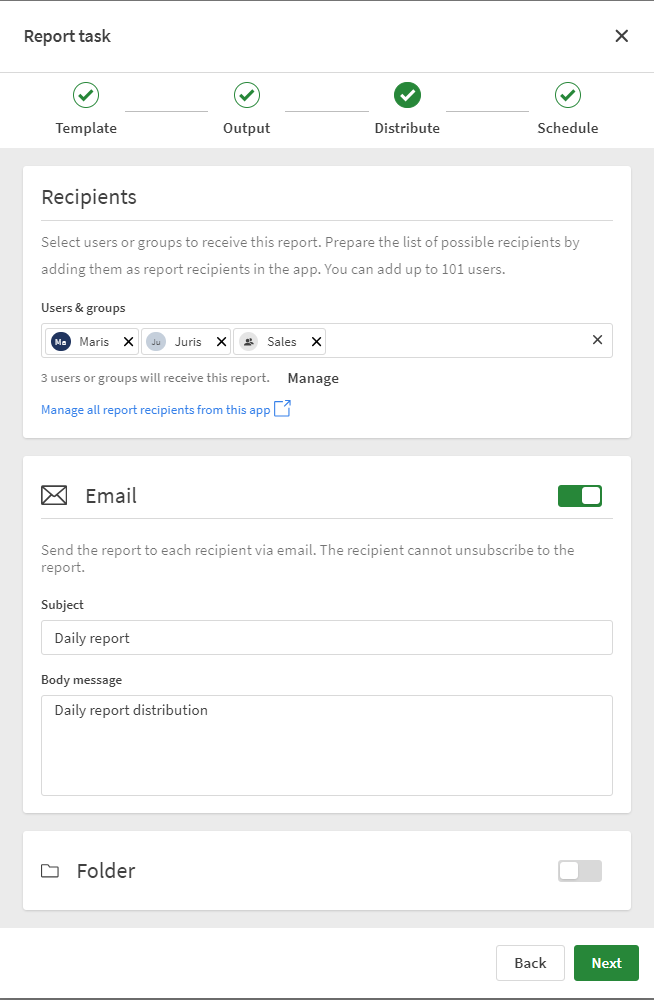
We also determine the dispatch frequency of these reports, which could be set to daily, hourly, or at any other chosen interval.

The result is the establishment of a system for regularly dispatching tailored reports.

Recipients will receive these reports via Qlik email in Excel format.
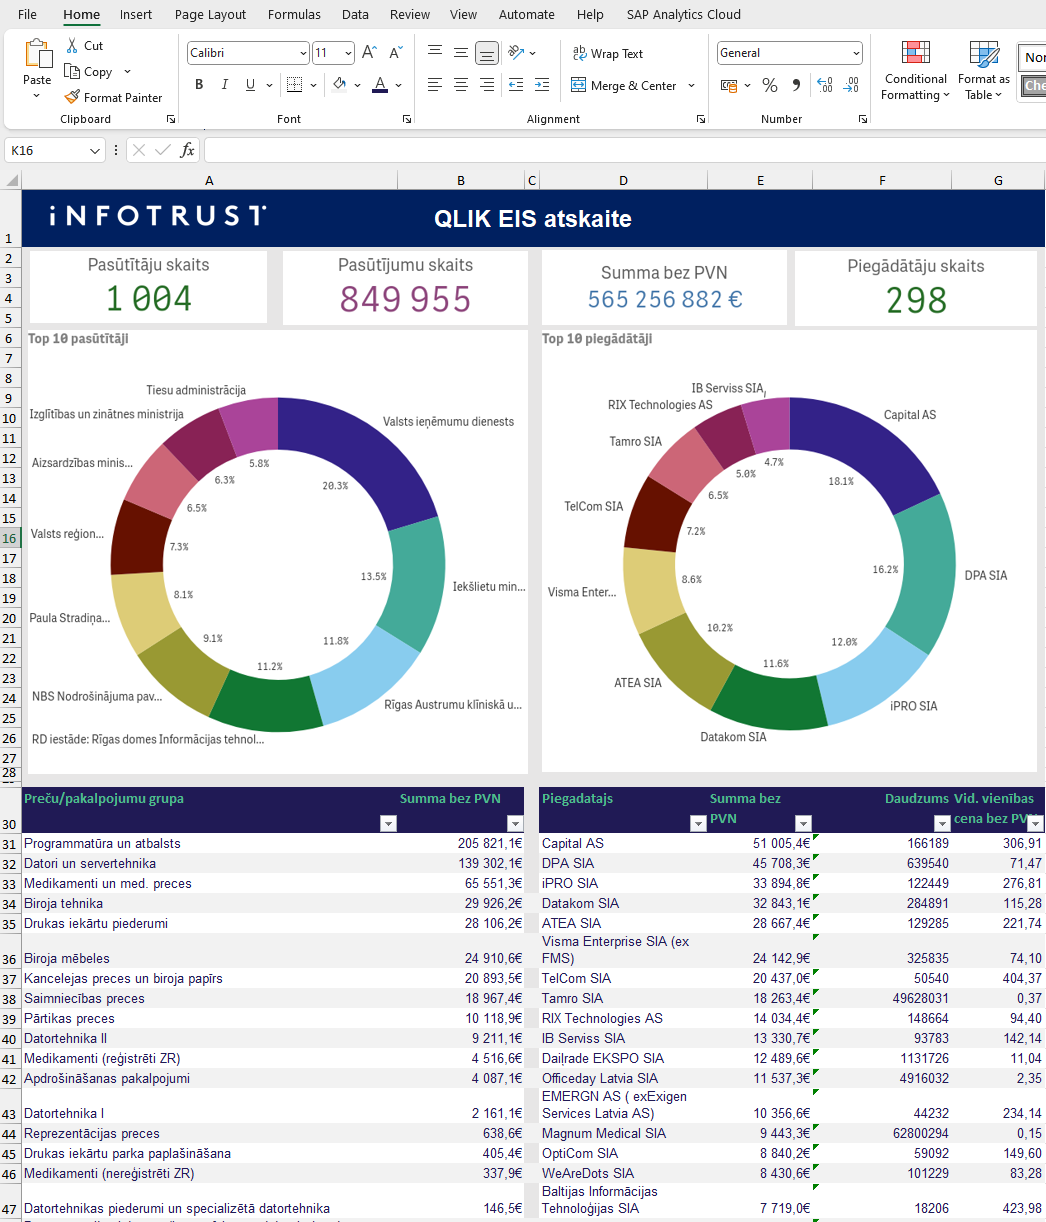
With this enhancement, we’ve got an additional method for facilitating “push” information access to numerous users, all anchored to our single source of truth. This approach not only broadens the scope of accessibility but also maintains the integrity and consistency of the information disseminated from our central repository of data.
Learn more here or contact us to help explore this new capability in your environment.

June 18, 2025
3 min