- Home
- /
- Qlik Cloud December 2024: what’s new

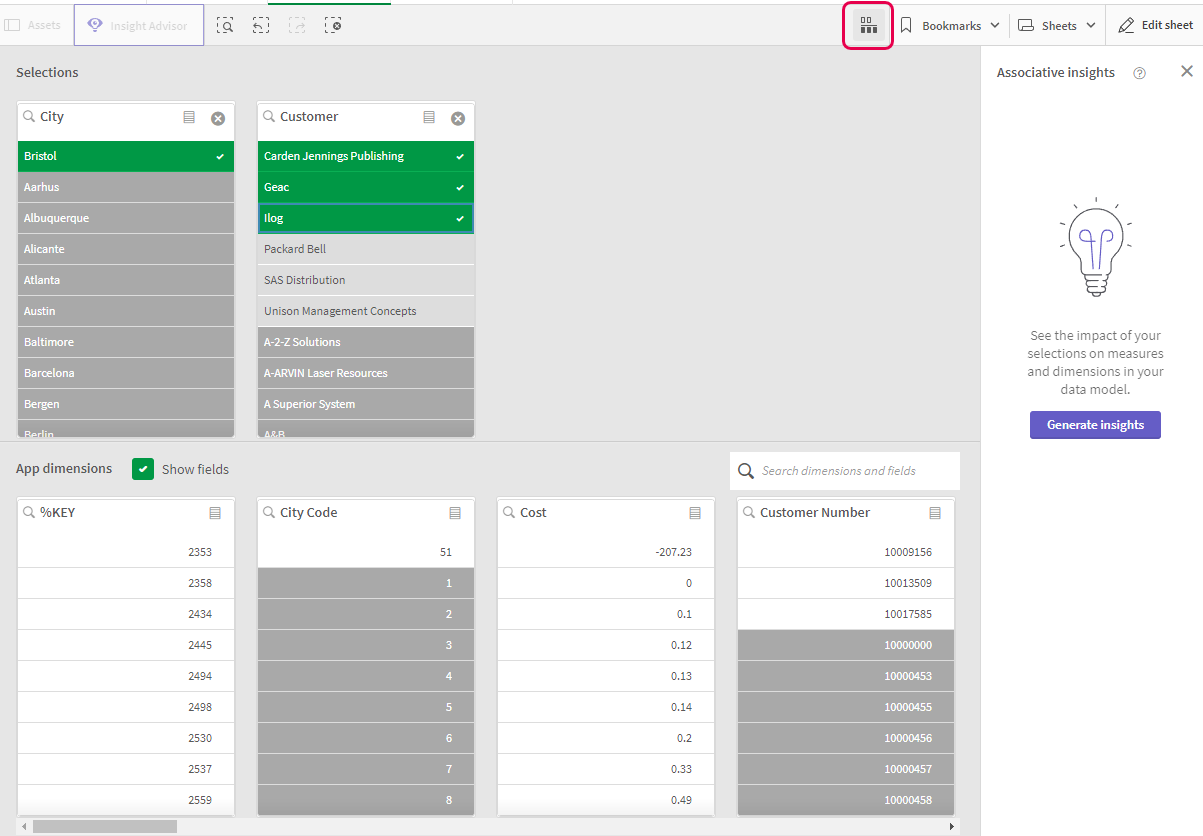
Calculated dimensions in the selections tool
The selections tool gets an upgrade and is improved to also handle calculated dimensions.
Machine Learning API
The Machine Learning API is a new public API that has been introduced to allow users to train, deploy, and predict with machine learning models with Qlik AutoML. You can use this API to integrate the power of Qlik AutoML and predictive analytics into your own software applications.
The existing real-time predictions API is being deprecated and replaced by the real-time prediction endpoint in the Machine Learning API. The functionality itself is not deprecated. For future real-time predictions, use the real-time prediction endpoint in the Machine Learning API.
Automated machine learning tutorial
Indent rows setting in the new pivot table
The new Pivot table in the bundle gets another presentation mode: choose indent row dimensions for a more compact view. Indent rows are intended for text hence images and links are not supported.
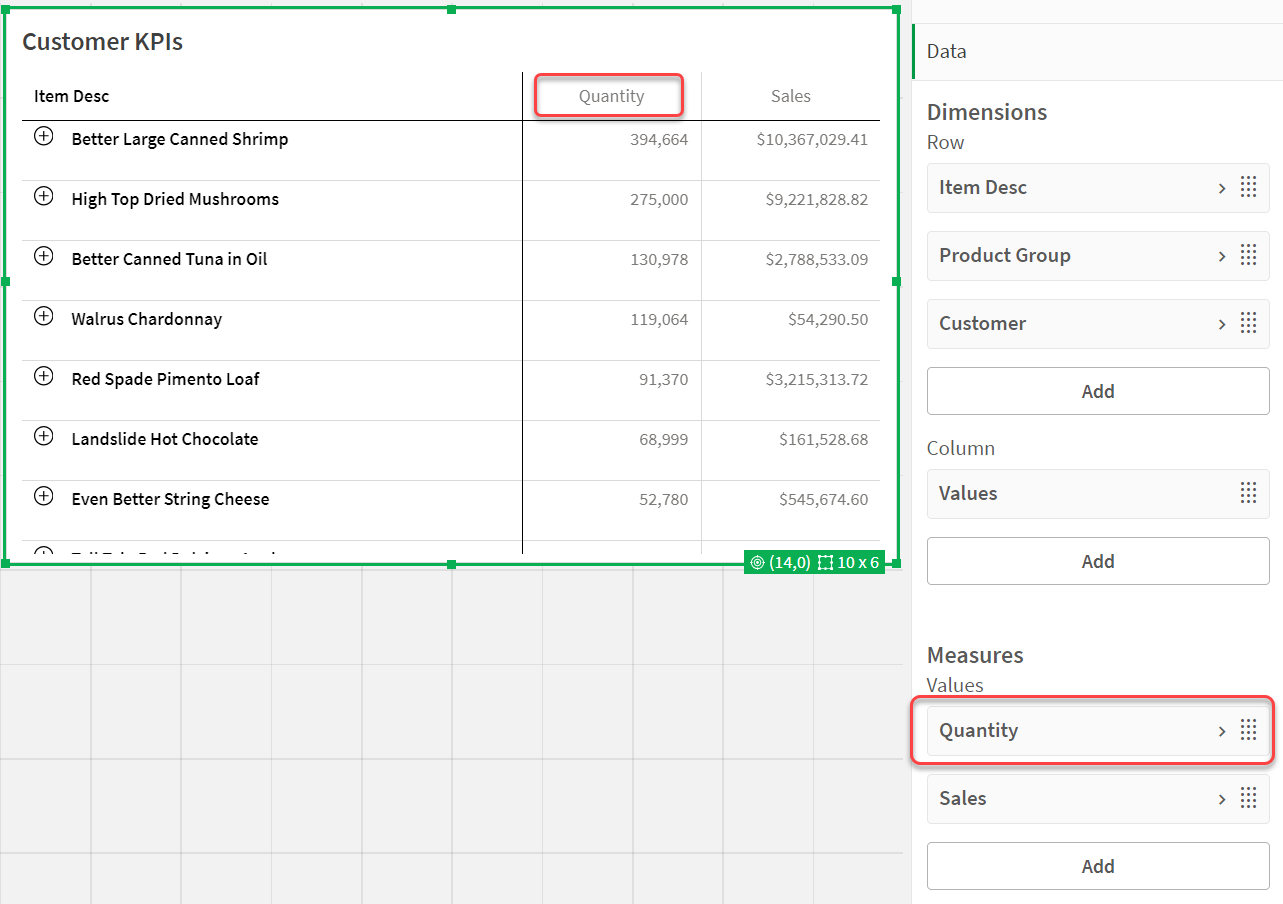
Table indicators in the new straight table
The new Straight table in the bundle is getting indicators. Add icons and colors based on thresholds, quick and easy on any measure.
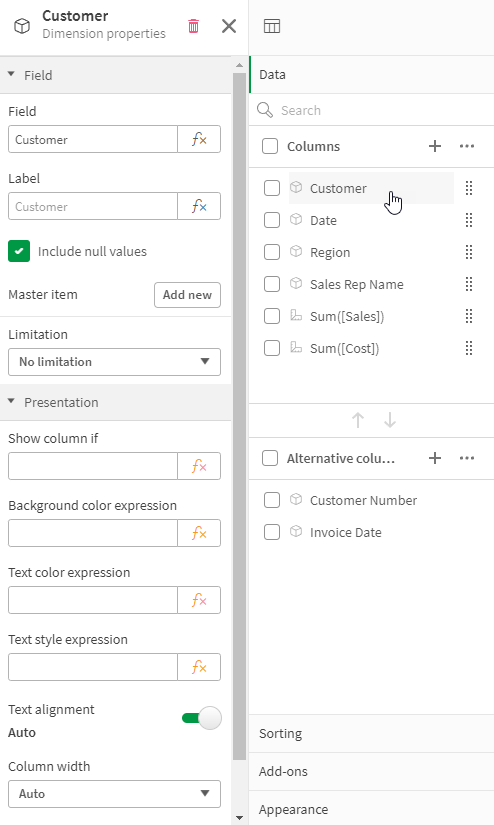
Table improvement
The new straight table gets support for mini charts. Add a second dimension and display the measure with sparklines, bars, or dots. Perfect for showing the trends and providing more context to make the measure more comprehensible.
Model monitoring in AutoML
ML deployments will now offer monitoring capabilities to review the number of predictions made and the feature drift. This will be available on new deployments if you use an add-on QlikAutoML tier.
Monitoring performance and usage of deployed models
Note: Not supported in Qlik Cloud Government.
Public monitored charts
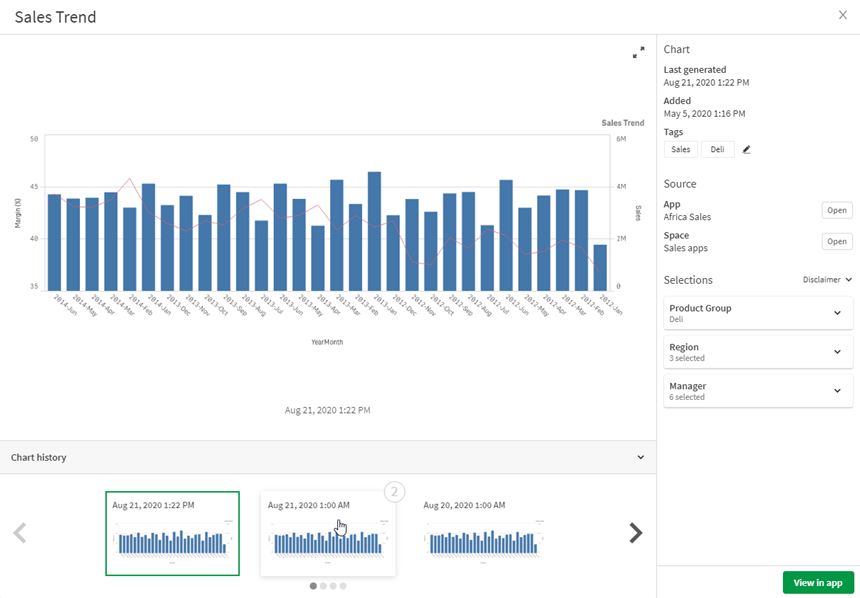
You can now add monitored charts to shared and managed spaces, streamlining analytics consumption by displaying key visualizations directly on the Insights activity center homepage. This ensures all users within your tenant can easily access and benefit from important insights.
New script function integrates user attributes
Qlik Sense adds a GetUserAttr function that is similar to the GetSysAttr function and allows developers and self-service users to leverage metadata from outside the app to drive in-app experiences. GetUserAttr provides information about the user accessing the app, which can then be used to create more advanced customization by applying per-user or per-group controls in the app.
Developers can leverage the users’ groups, email, or subject information to do actions such as:
GetUserAttr – script and chart function
More table improvements
More support for cyclic dimensions in the new straight and the pivot table. Column now includes a dropdown for quick access of cyclic group fields.
Selecting active fields from cyclic dimensions in straight tables
Selecting active fields from cyclic dimensions in pivot tables
Current values displayed in variable dialog
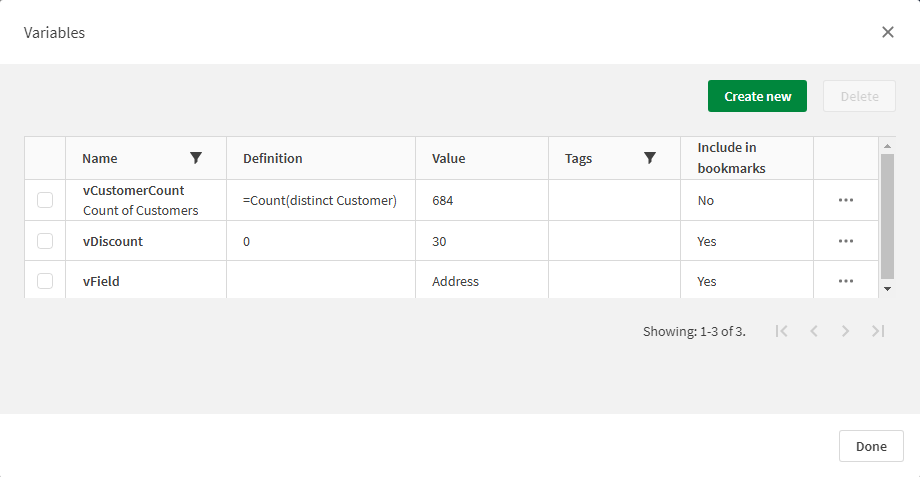
The values in the variable dialog now change as changes are made in the app, such as by the variable input control.
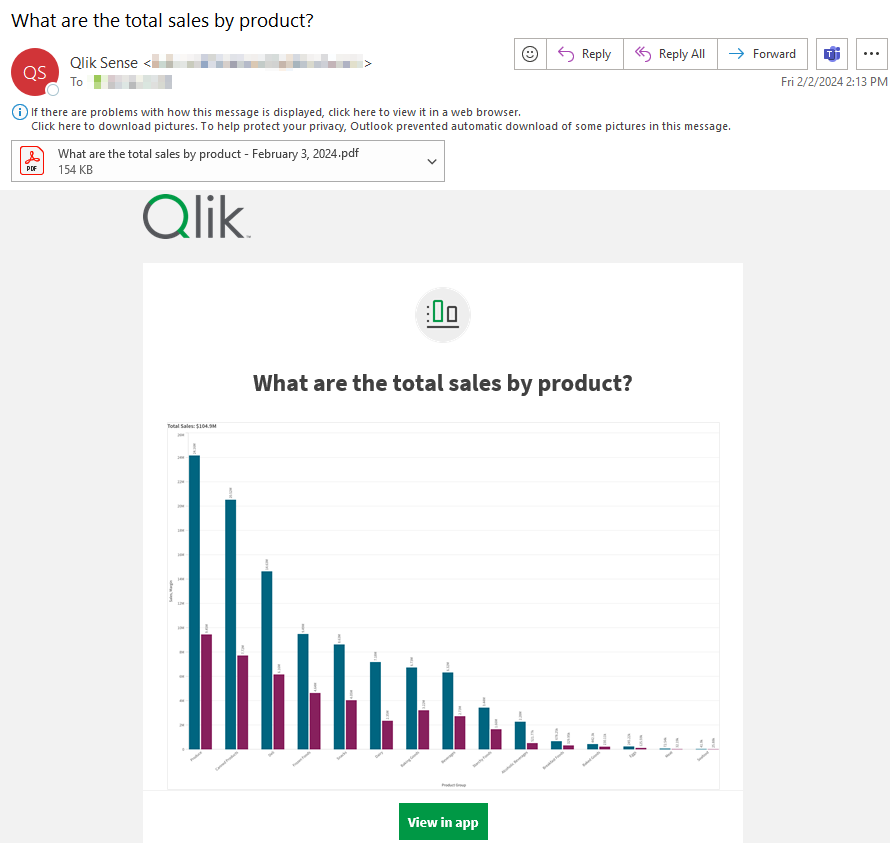
Subscription to sheets – Preview button
Subscriptions to sheets just got easier with a Preview button so that a user can check what the output of their subscription will be before scheduling it (e.g. validate sheet order, or selections applied). A secondary benefit is that it could be used as an ad-hoc multi-sheet download, which the user can subsequently decide to schedule if they like the output.
Scheduling reports with subscriptions
New variable options for including current state in bookmarks and reports
You can now control at the variable level whether or not a variable’s current state is included in bookmarks and reports.
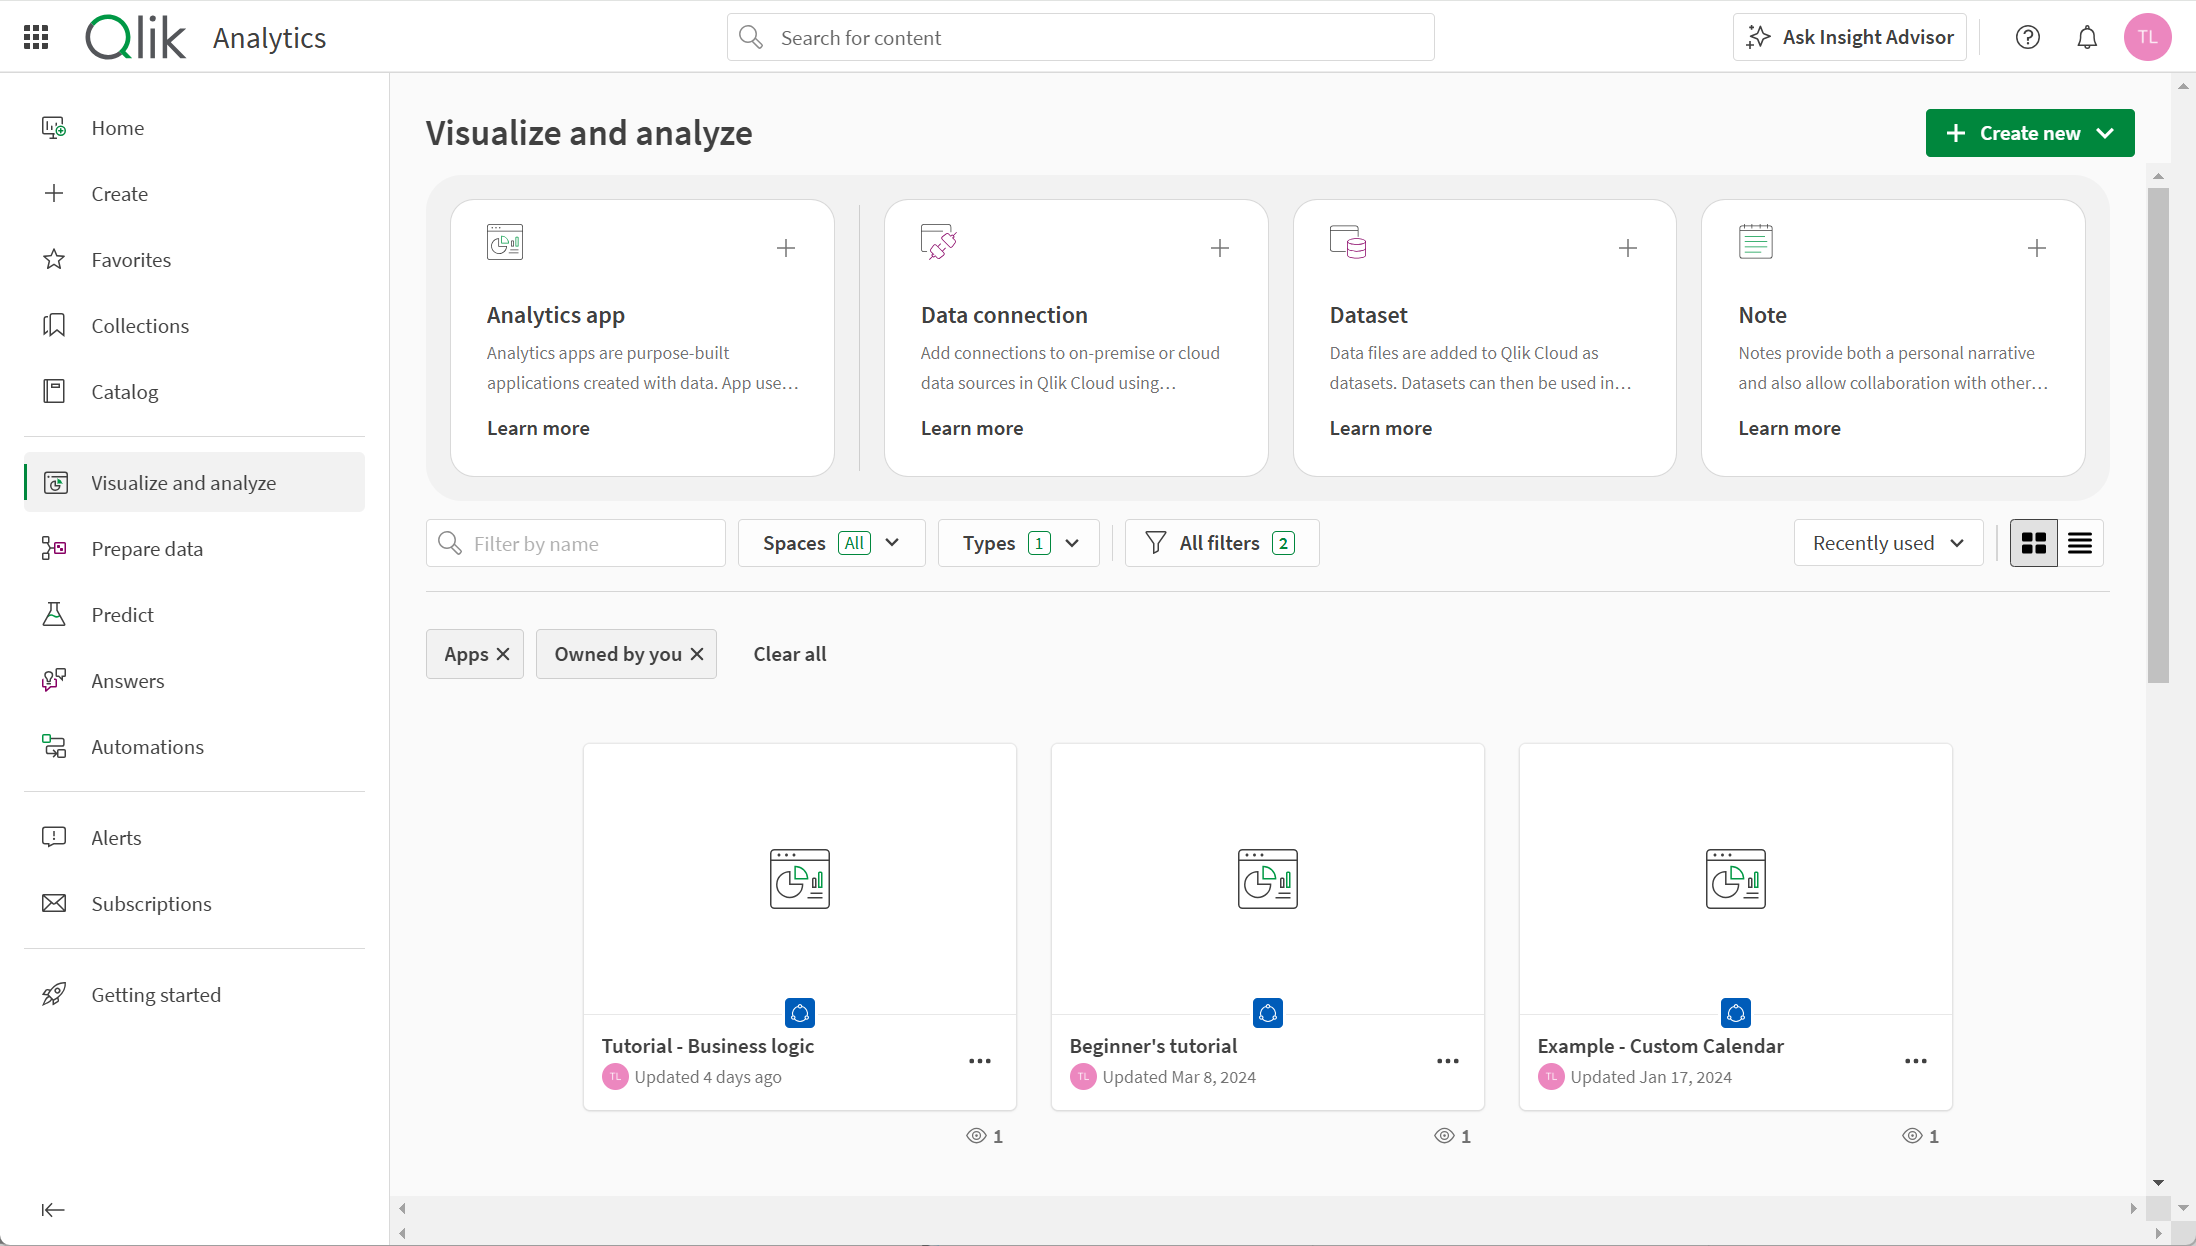
Qlik Cloud Analytics mini-homes
The Qlik Cloud Analytics activity center now includes mini-homes. Mini-homes provide a selection of alternate home pages aimed at specific analytic purposes. Each mini-home provides creation options related to that activity. The following mini-homes have been added:
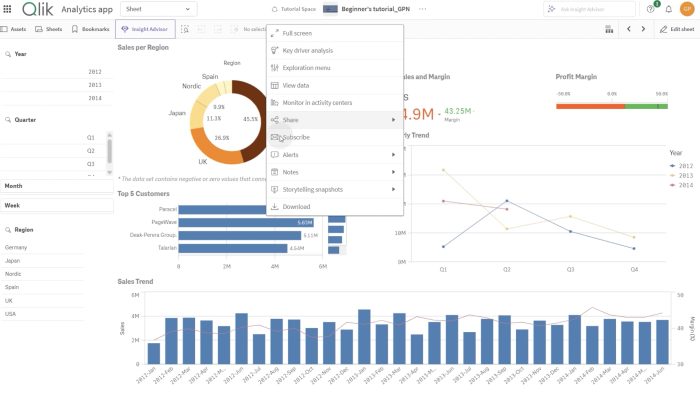
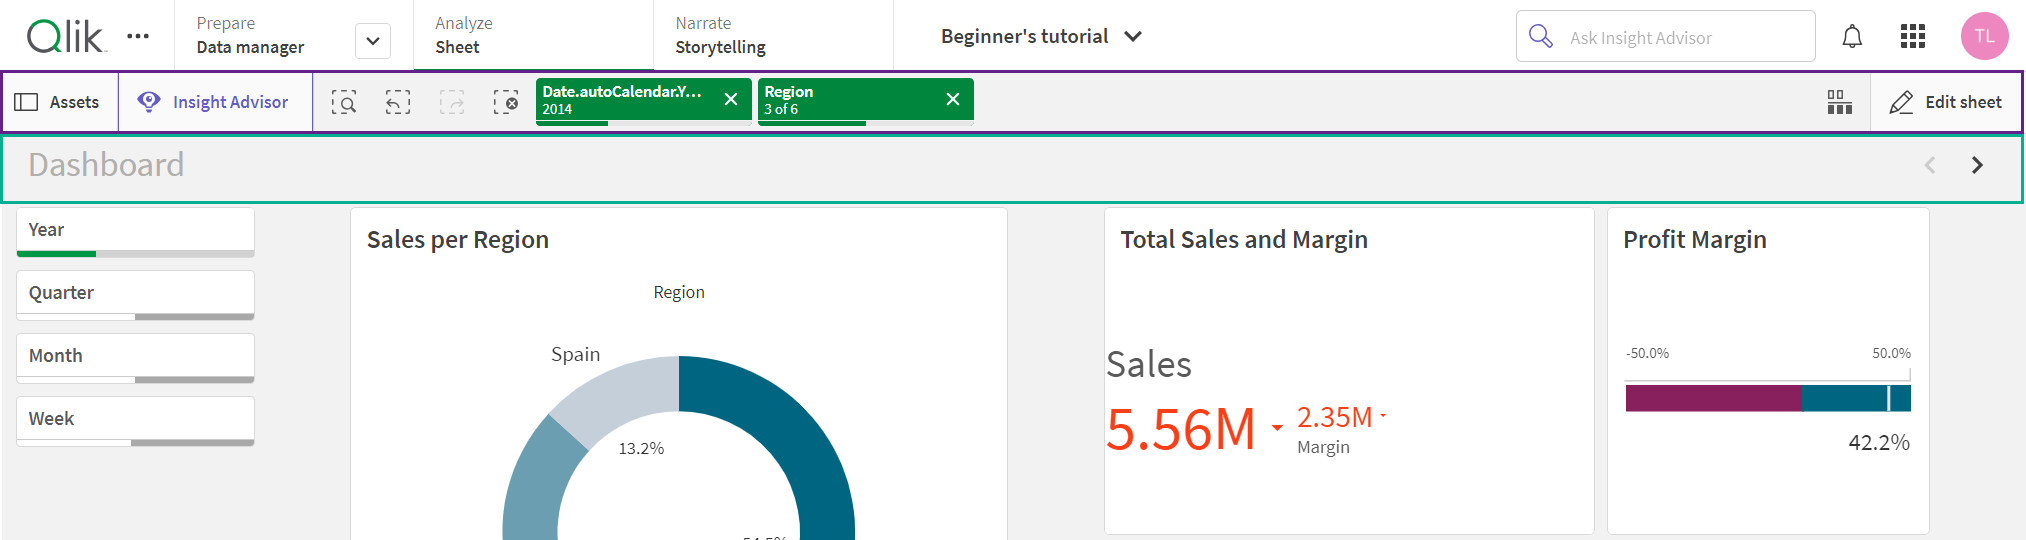
New toolbar customization settings
As requested by customers, you can now add shortcut buttons to Sheets and Bookmarks in the toolbars of your analytic apps. These buttons open the assets panel to either Sheets or Bookmarks. You can add these buttons from UI settings in your app settings.
Expanded region support for Qlik Answers
Qlik Answers is now supported in the following regions:
Deploying and administering Qlik Answers
Custom parameters for Execute automation action in buttons
The button action Execute automation can now be used to send custom parameters directly to your automations without requiring a temporary bookmark. This is useful for creating writeback solutions in a large app as creating and applying bookmarks can take longer in large apps.
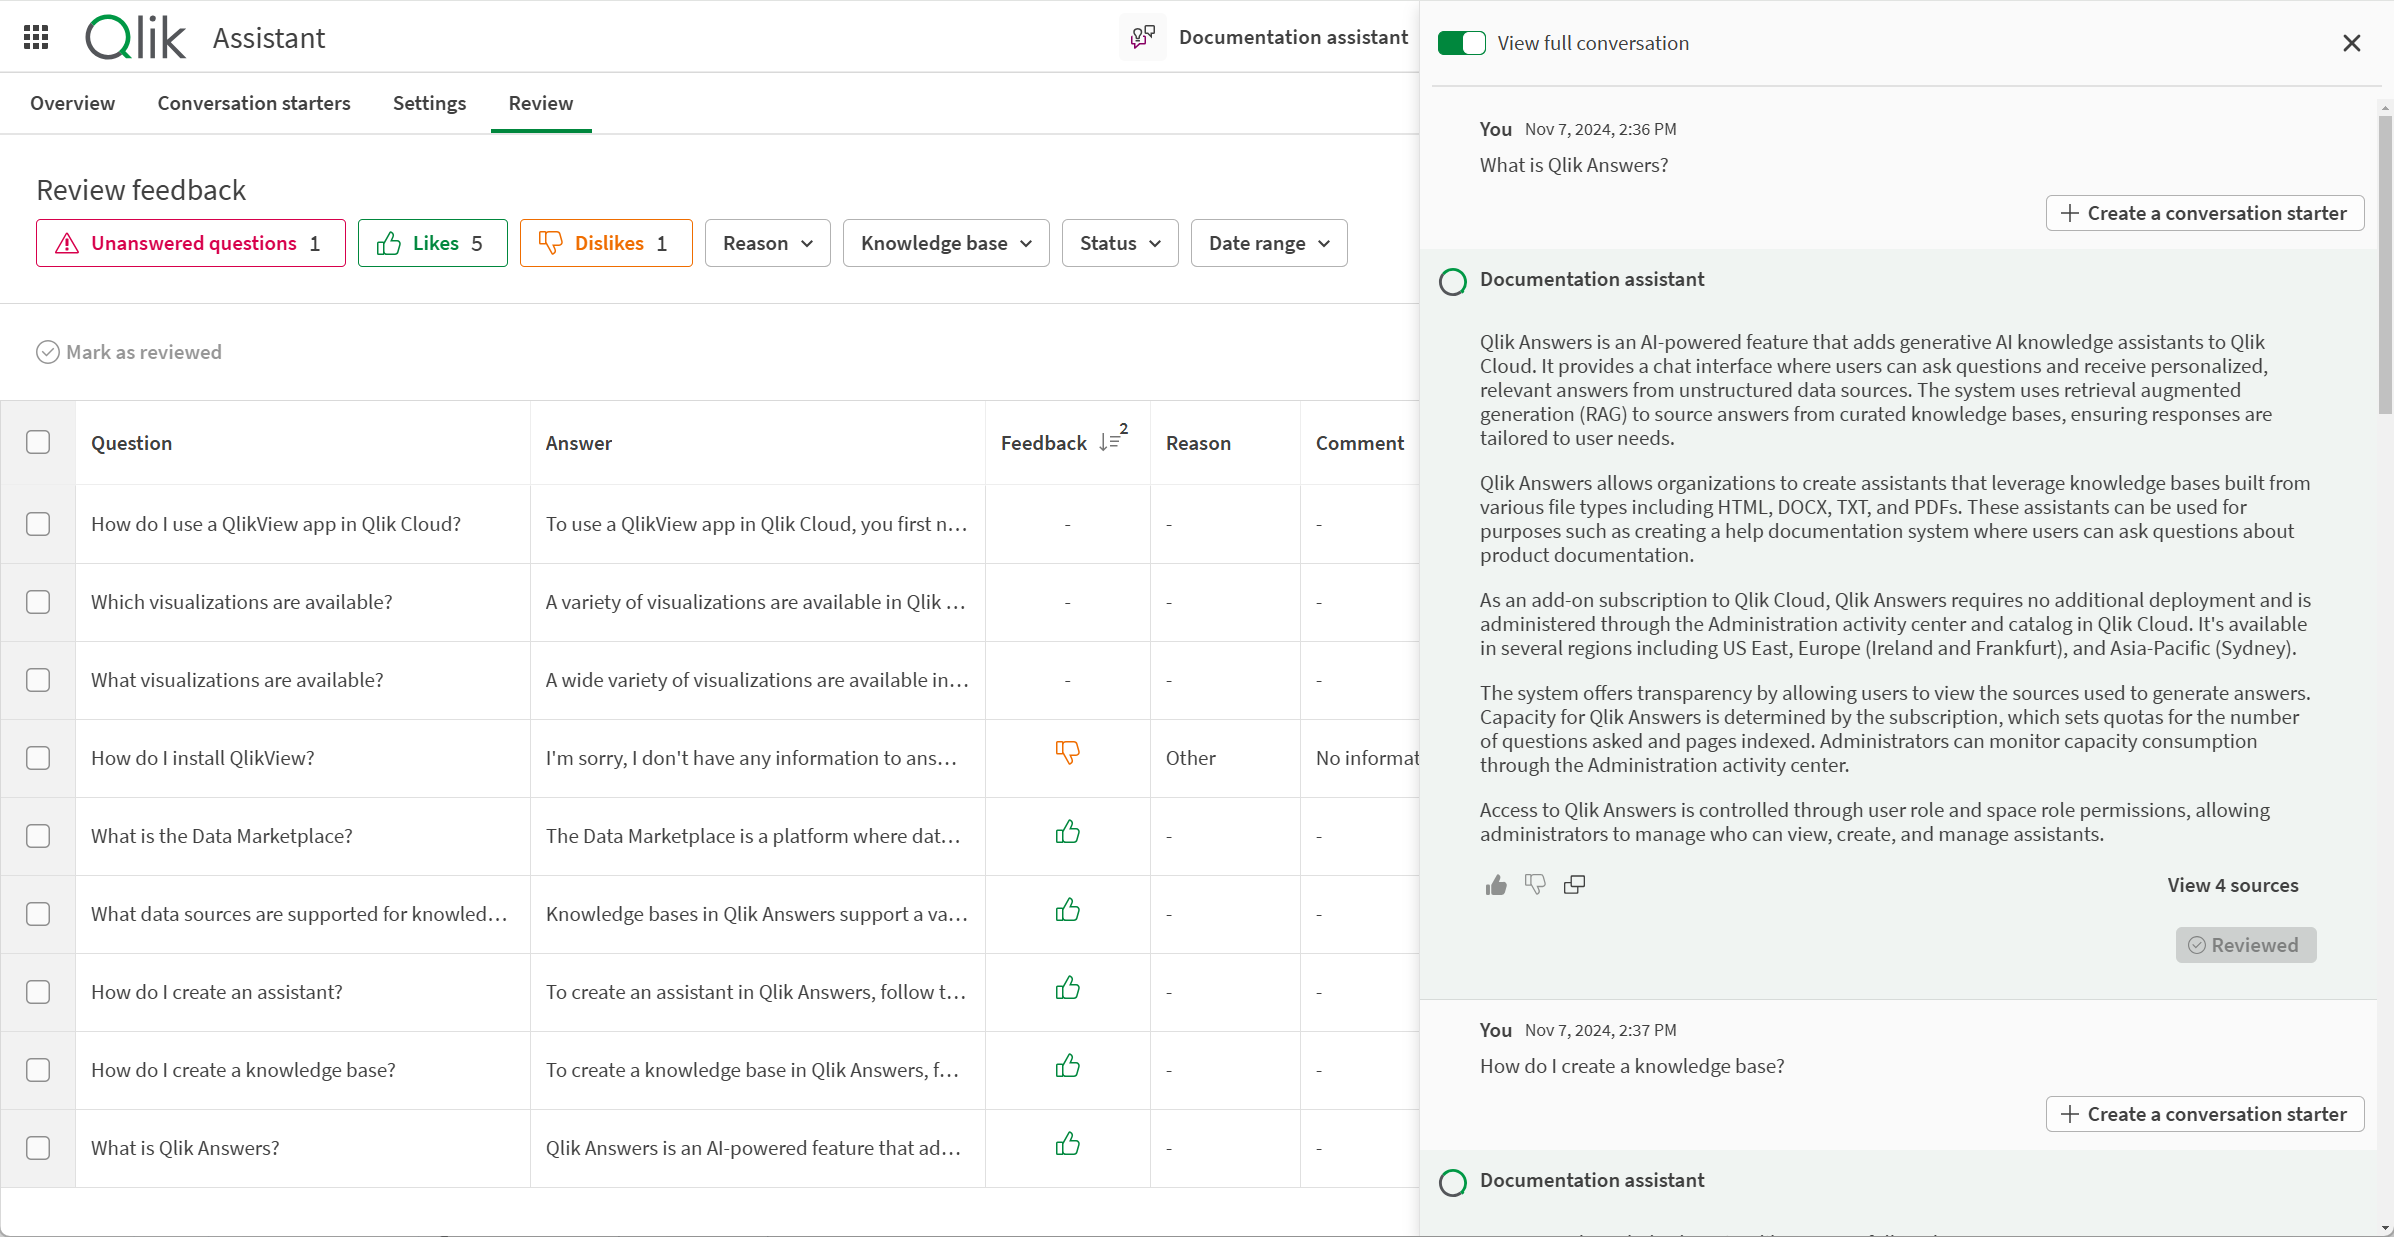
Assistant review page
The updated view of an assistant’s Review page provides a better experience to view questions and assistant responses. You can now sort or filter on the columns to review the highest priority conversations.
Use this to fix existing content or add more content to your knowledge bases so that future responses are accurate.
Celebrating the Latest Features Available in Qlik Reporting Service™
Reports might be everywhere, but they don’t have to be boring.
This December, Qlik Cloud Reporting Service is giving you the tools to make your reports shine ✨:
✅ PixelPerfect Authoring for flawless, aesthetic reports
With PixelPerfect report authoring in Qlik Cloud Analytics, it is now possible to create visually stunning, highly customized reports with pixel-level precision. With its intuitive interface, PixelPerfect gives you precise control over every element of your design, so you can create branded reports that perfectly align with your company’s presentation standards — and deliver them via burst report delivery or on-demand end user customized download.
Designing PixelPerfect report templates
Videos: Designing PixelPerfect report templates
Note: Not supported in Qlik Cloud Government.
✅ Report Cycling to automate tasks across dimensions
Report developers can now configure their tabular or PixelPerfect report tasks to cycle over dimensions to produce a report per dimension value for each recipient.
✅ Task History for seamless troubleshooting
Report developers now have greater visibility into their report task executions. With report task history, report developers can now see 90 days of task execution history. The history shows task metadata and where there are errors, error descriptions are available to allow the report developer to begin troubleshooting. If you cannot resolve the error, a trace ID is available to expedite any required call to Qlik Support.
Viewing execution history for report tasks
Get the full details here>
Custom navigation experience
You can now create custom navigation experiences in your Qlik Sense apps on Qlik Cloud Analytics! 🚀🎉
Check out Mike Tarallo latest video to see it in action, and don’t stop there—experience the new features yourself with my interactive feature tours!
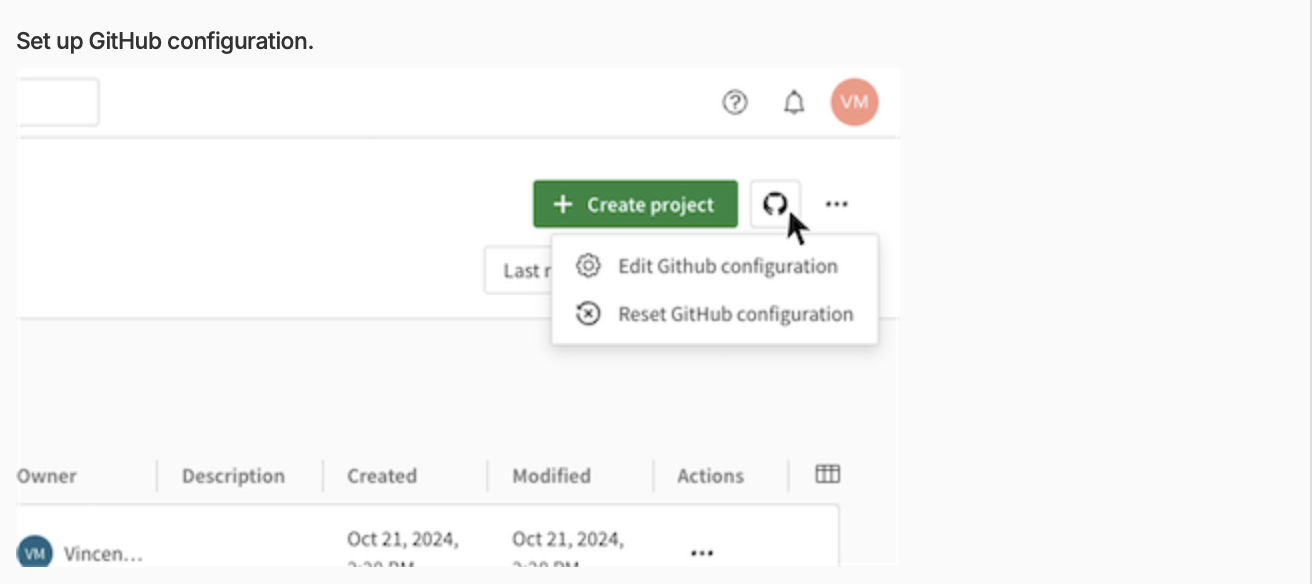
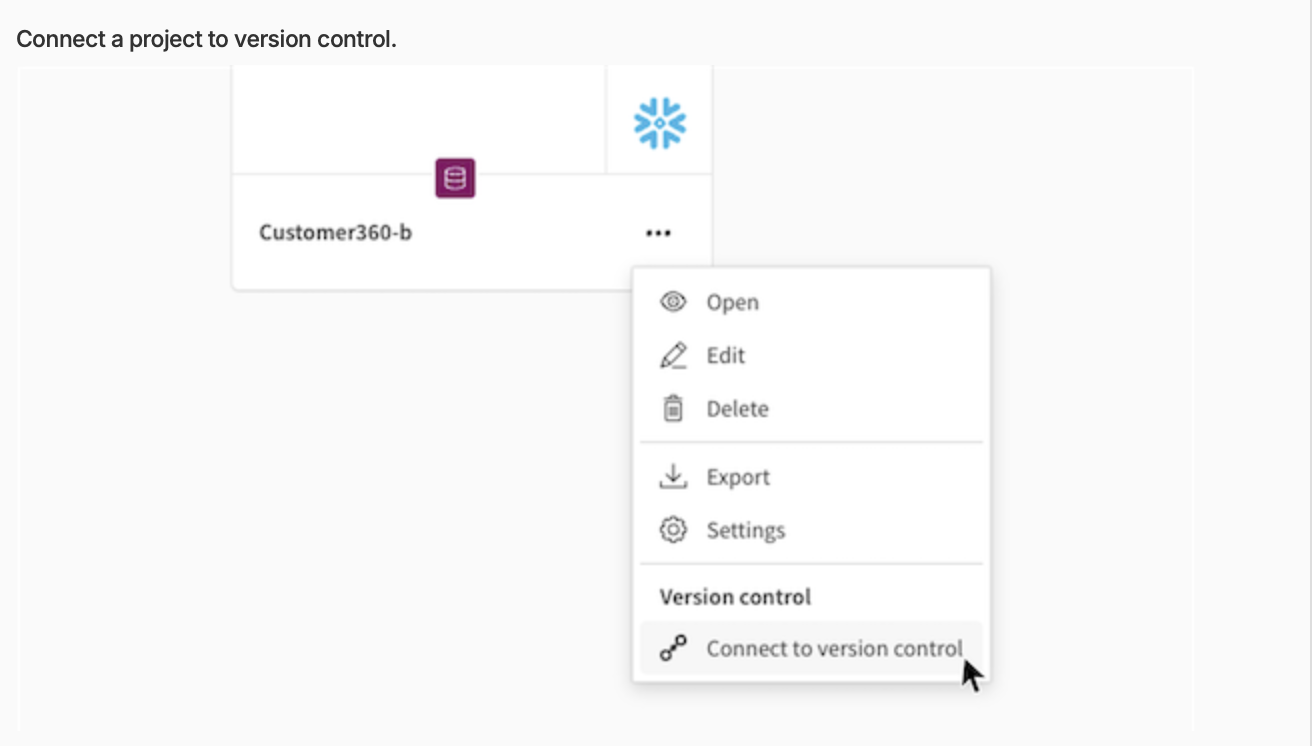
Version control with GitHub
Version control empowers developers to work concurrently on different aspects of a project in Qlik Talend Cloud pipelines.
Thanks to a branching strategy, developers can isolate a feature and edit a project without affecting the main branch. Using GitHub, projects can be shared across branches, spaces and tenants.
For each branch, users have the option to customize the schema prefix to be added to all datasets in the branch to avoid conflicts. Once changes are made on their branches, users can synchronize changes with a remote repository, and commit and push their changes. They can also create pull requests from GitHub, where team members can review and approve the code before it is merged back into the main project.
Version control allows team members to sync their changes and collaborate efficiently while avoiding conflicts and ensuring pipeline integrity.
Version control is available from Qlik Talend Cloud Standard edition and upwards.
New Dates processor in transformation flows
A new Dates processor is now available as part of transformation flows in Qlik Talend Cloud.
The Dates processor makes it easy to manipulate date and time data. It offers various functions to convert from and to date data types, as well as calculation functions such as adding time or getting the time difference between dates.
Parallel Load improvements
Data movement in Qlik Talend Cloud has supported loading multiple tables in parallel for Replication, Landing and Lake Landing tasks. From this release, parallel load definitions are now also supported for individual tables during the full load of data into a target data platform. This helps to significantly improve task performance with the ability to split a source table into ‘segments’ which are then loaded in parallel.
These ‘segments’ are configurable by data ranges for one or more columns* (for example date ranges, PK segmentation etc.). If the source table is partitioned, in a source which supports the parallel load feature, then the segments can be automatically interpreted by source table partitions, or by sub-partitions. Parallel Load is supported for Replication, Landing and Lake Landing tasks.
Note: The maximum number of segments and other tables to load in parallel is controlled by the Maximum number of tables to load in parallel setting.
To learn more including the supported sources and targets for parallel load and any limitations see Loading dataset segments in parallel.
……. … ………… ….
Any questions please contact our consultants. Responding in one working day.