- Home
- /
- Qlik Cloud October 2024: what’s new

August and September 2024 updates are included below.
Combo chart improvements
You now have the option to display labels on stacked measure segments.
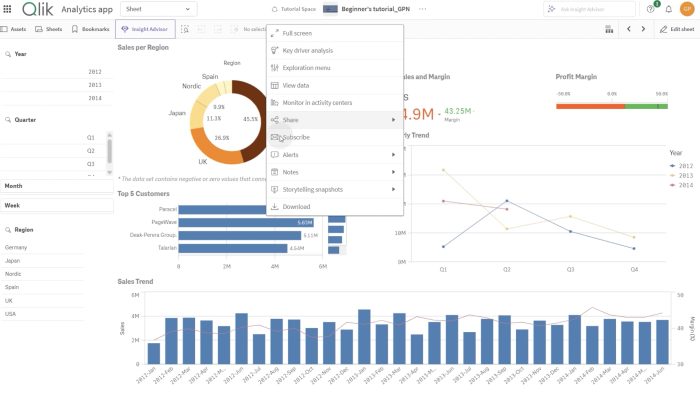
Selection bar improvements
We have made improvements to the way labels work in the selection. If the user has provided a label to a master dimension, then that label will be used rather than the field name in the underlying data model. This will improve usability and make it easier to create multilingual applications.
Localization of embedded analytics in ML experiments
Embedded analytics is now localized to the user’s chosen UI language. Note: Not supported in Qlik Cloud Government.
Exporting data from ML experiments
Datasets used for testing while training models can now be exported to a space for further analysis. Note: Not supported in Qlik Cloud Government.
Qlik Anonymous Access
“Qlik Anonymous Access” simplifies engagement with analytics content by eliminating the need for user accounts and complex authentication. This can be used with embedded content (qlik-embed) as well as with a full link to a Qlik Sense application. It allows you to broaden access to external partners, clients, and stakeholders, promoting collaboration and knowledge sharing. And it helps you to easily scale to meet changing user demands without the need to manage user accounts. Note: Qlik Anonymous Access subscriptions are not available in Qlik Cloud Government.
Qlik Anonymous Access subscriptions
Sharing app content with anonymous access
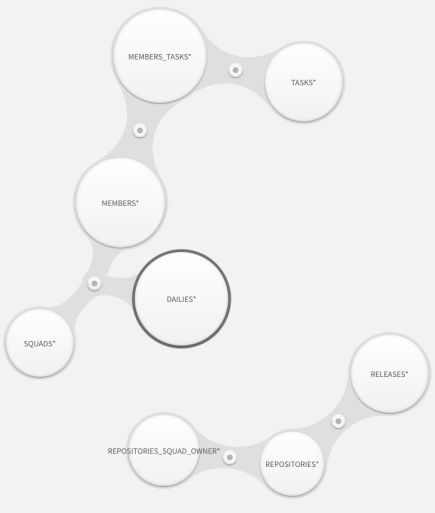
Hierarchical data file management
We have introduced our new Enhanced File Management feature in Qlik Cloud—making organization effortless! Now you can seamlessly structure your uploaded and cloud generated files into directories and subdirectories, giving you full control over your data.
With batch actions like move, copy, cut, and paste, managing multiple files has never been easier or faster. Streamline your workflow, reduce clutter, and stay organized with just a few clicks.
Managing data files for tenant and analytics administrators
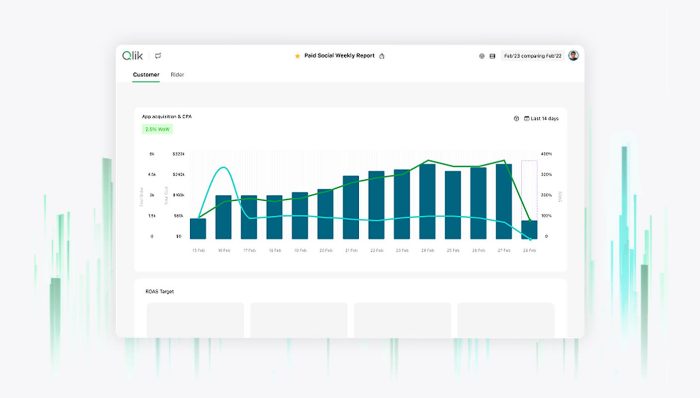
Chart background image by URL
Chart background by URL may seem small but offers huge potential to style and build up a highly dynamic and stylish app.
Useful for:
Image by URL can be used in:
Time-aware training in AutoML
Users with training data that is sensitive to changes over time can optionally choose to use a date as their test-train split parameter when configuring an ML experiment version. Note: Not supported in Qlik Cloud Government.
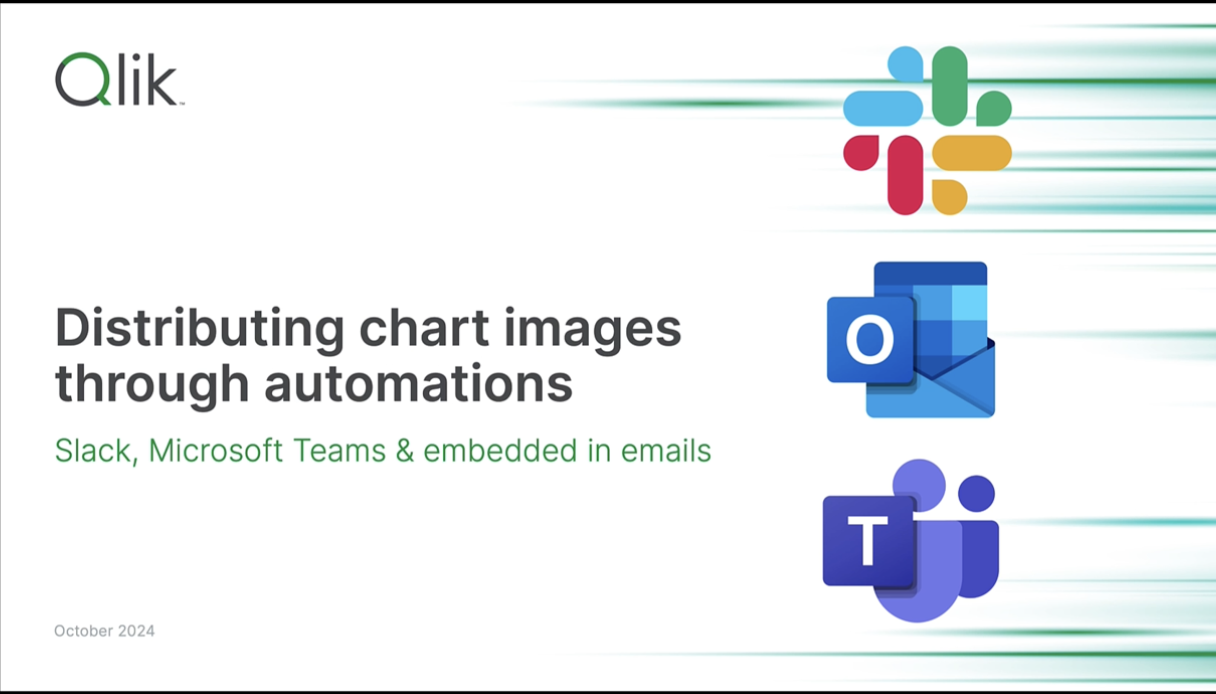
Distribute chart images through Qlik Application Automation
One of the major steps toward improving how users interact with data and visualizations in their daily workflows.
We have introduced the Get Chart Image block in the Qlik Reporting connector. This new feature allows users to generate chart images directly within their automation workflows, streamlining the process of sharing visual insights.
Key Features
Generate Chart Images: Easily create images from your charts without the need for manual screenshots or additional tools.
Distribute Effortlessly: Utilize various connectors within Qlik Application Automation to share these images across multiple platforms, including popular chat tools like Slack and Microsoft Teams.
Embed in Emails:Seamlessly embed chart images into HTML emails, ensuring that your recipients receive immediate visual insights.
Store in Cloud Services:Safeguard your generated images by storing them on cloud storage solutions such as Microsoft SharePoint, Amazon S3 or Dropbox.
This update significantly enhances the reporting process by enabling:
Snowflake target connections in Data Integration now support key pair authentication
Key/pair provides a more robust authentication method than user/password for connecting to Snowflake with your service accounts. This approach is recommended for workloads such as data loading (replication or landing tasks) and transformations.
Additional Qlik Talend Cloud application connectors
We are continuing to expand the connectivity of Qlik Talend Cloud with the addition of more insurance- and security-related applications that can now be used as a data source. By eliminating the need to develop custom connectors to access these sources, these connectors will help companies streamline their insurance workflows and accelerate their ability to fully assess security risks and compliance. The new connectors are:
Qlik Talend Data Integration improvements
Several issues have been resolved. If you are using Data Movement gateway, upgrade to the latest version to benefit from the resolved issues. For a list of resolved issues as well upgrade instructions (for Data Movement gateway), see Upgrading the Data Movement gateway installation.
Customizable data quality in Qlik Talend Data Integration
The latest Qlik Cloud Catalog update brings customizable data quality capabilities, allowing users to tailor data quality compute, and offering enhanced flexibility to better align data quality processes with business needs while optimizing resource usage.
Key features:
……. … ………… ….
Qlik Cloud July 2024: what’s new – read here.
Qlik Cloud August-September 2024: what’s new – read here.
Any questions please contact our consultants. Responding in one working day.