Contact us

Let‘s talk about data analytics for your company

Contact us

Create visualizations with Qlik Sense (in Latvian)

  • In Latvian (onsite or online: please let us know Your preferences)
  • Class Type and Duration: Instructor-led, 2 days
  • Price per participant for 2 days: EUR 840
  • Invoice from SIA Infotrust – prepayment will be needed (re. other payment terms prefered kindly write riga@theinfotrust.com or vilnius@theinfotrust.com)
  • E-material will be accesible 6 month after the trainings on Qlik education portal
  • Confirmation of attendance document will be provided

Description

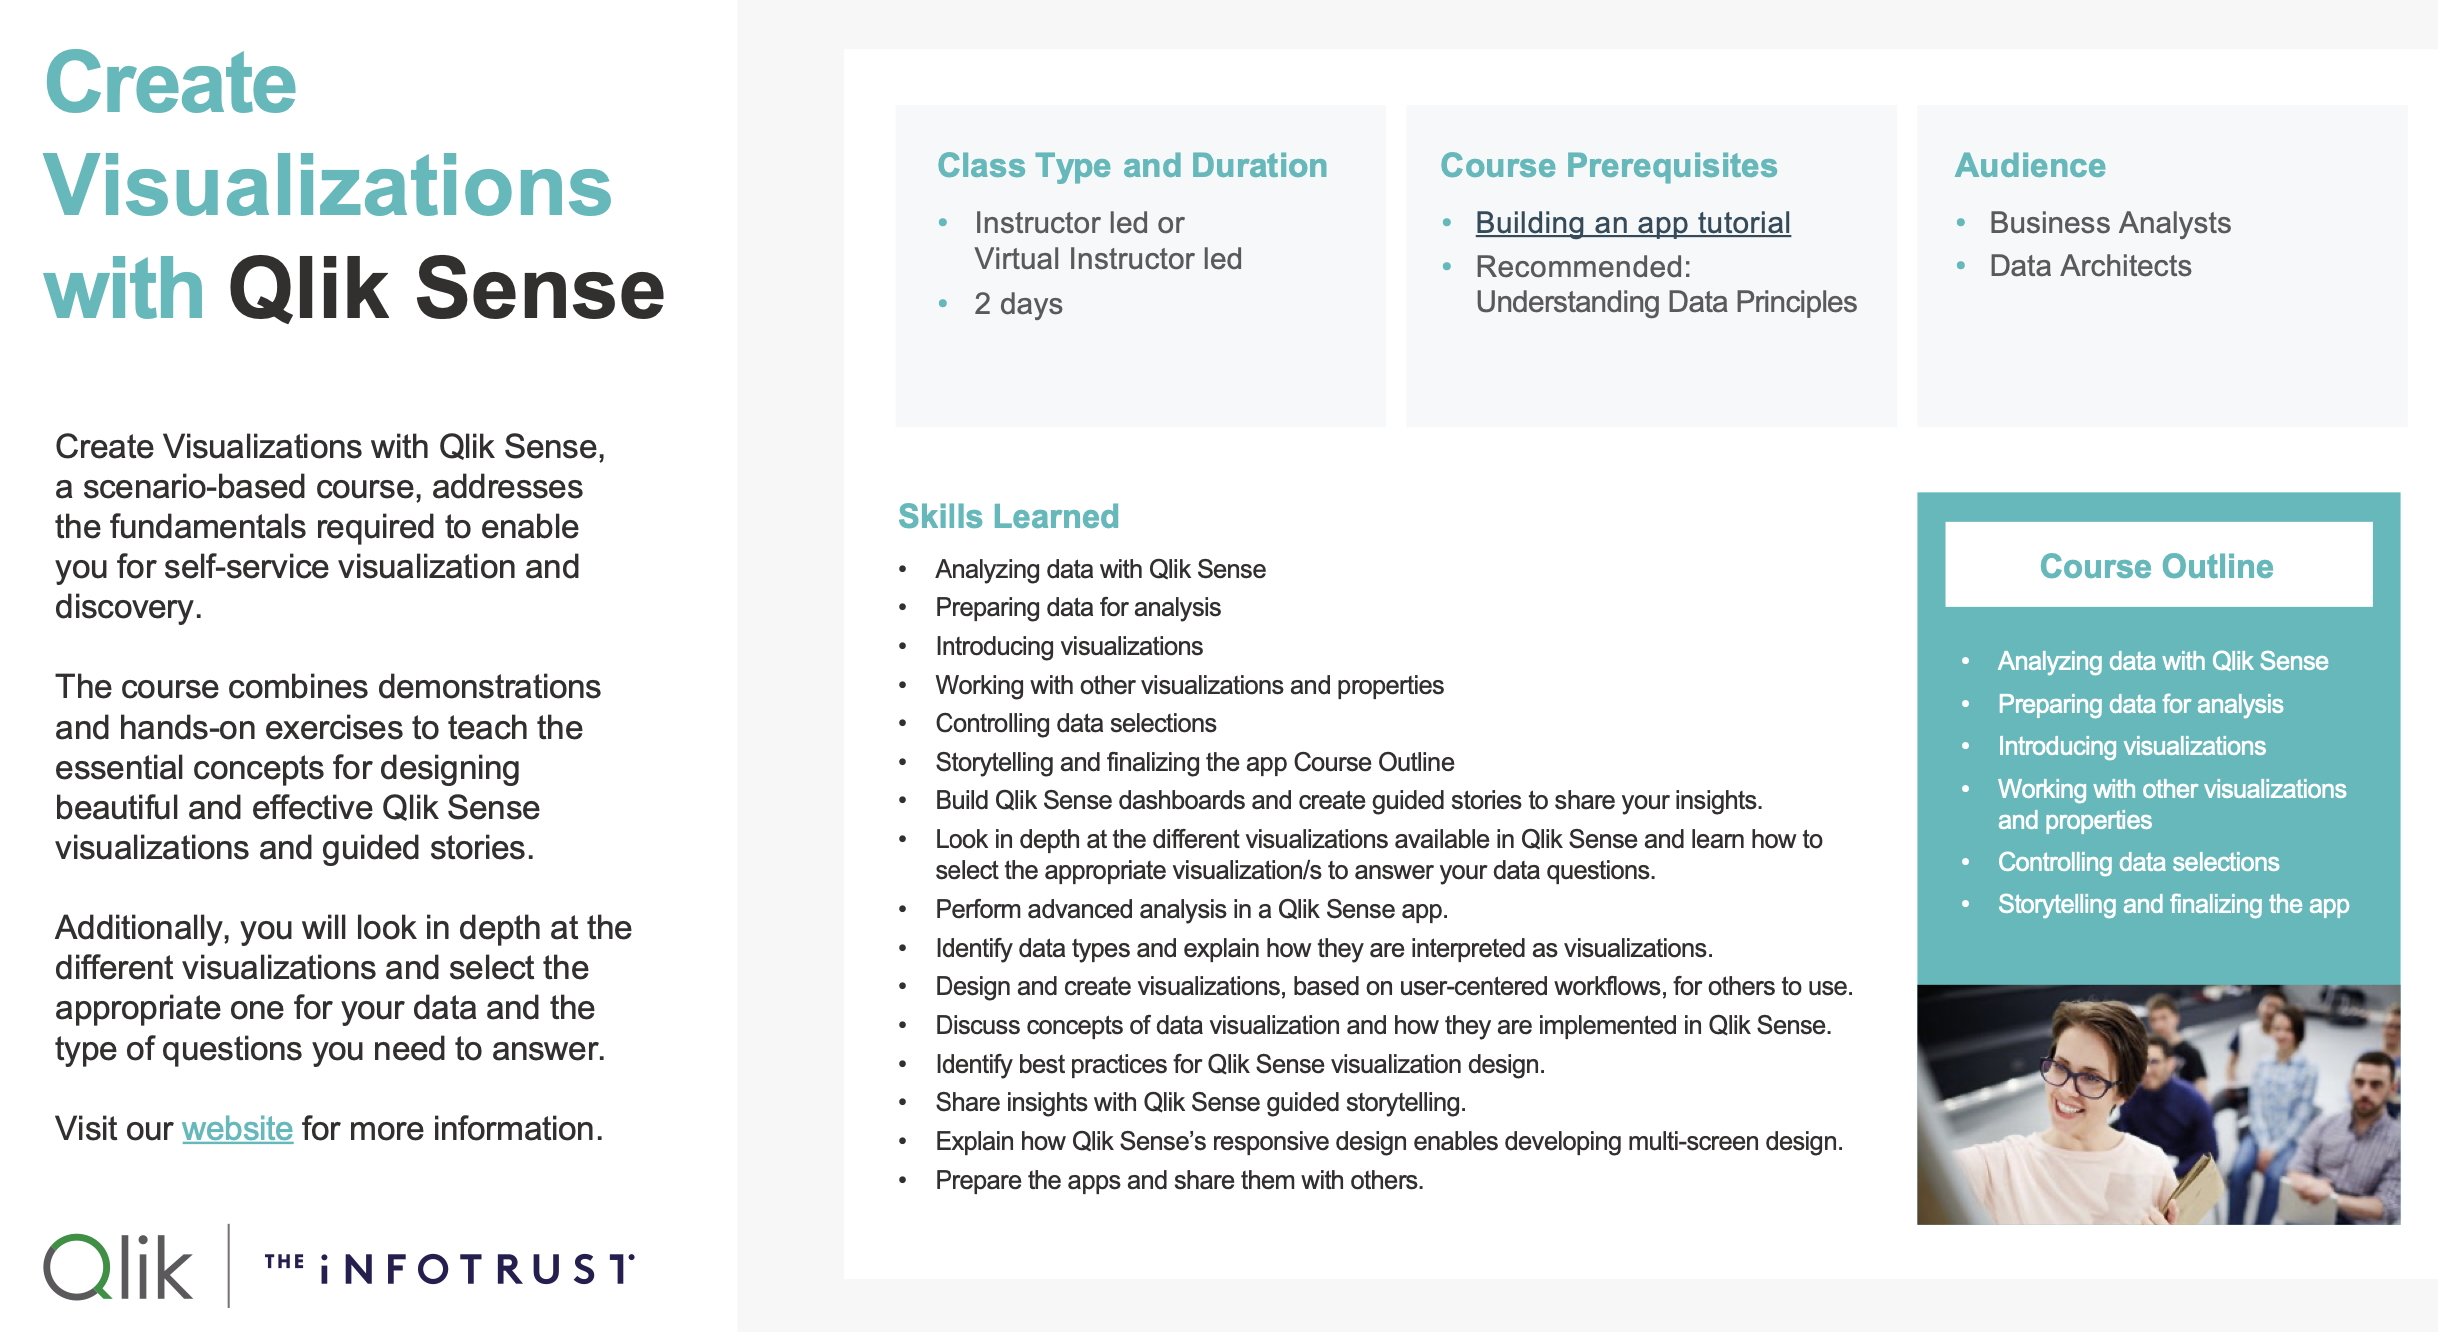
Create Visualizations with Qlik Sense, a scenario-based course, addresses the fundamentals required to enable you for self-service visualization and discovery. The course combines demonstrations and hands-on exercises to teach the essential concepts for designing beautiful and effective Qlik Sense visualizations and guided stories. Additionally, you will look in depth at the different visualizations and select the appropriate one for your data and the type of questions you need to answer.

Course Prerequisites

  • Building an app tutorial (visit Qlik Help for more information)
  • Recommended: Understanding Data Principles

Audience

  • Business Analysts
  • Data Architects

Skills Learned

  • Build Qlik Sense dashboards and create guided stories to share your insights.
  • Look in depth at the different visualizations available in Qlik Sense and learn how to select the appropriate visualization/s to answer your data questions.
  • Perform advanced analysis in a Qlik Sense app.
  • Identify data types and explain how they are interpreted as visualizations.
  • Design and create visualizations, based on user-centered workflows, for others to use.
  • Discuss concepts of data visualization and how they are implemented in Qlik Sense.
  • Identify best practices for Qlik Sense visualization design.
  • Share insights with Qlik Sense guided storytelling.
  • Explain how Qlik Sense’s responsive design enables developing multi-screen design.
  • Prepare the apps and share them with others.

Course Outline

  • Analyzing data with Qlik Sense
  • Preparing data for analysis
  • Introducing visualizations
  • Working with other visualizations and properties
  • Controlling data selections
  • Storytelling and finalizing the app

By registering, You confirm that You have read and agreed to Privacy policy&Infotrust statement.

Registration

By registering, you confirm that you have read our Privacy and Cookie Policy, agree to provide your contact details, and consent to their use for information about the event or training you have registered for, as well as for future invitations to similar events or technology-related news (sent no more than once a month). You can unsubscribe from our newsletters at any time.

Thanks for reading and accepting Privacy policy & Infotrust statement

Other events

840 €
November 7-8, 2024 | 9:00-17:00
Online , in English

Registration

By registering, you confirm that you have read our Privacy and Cookie Policy, agree to provide your contact details, and consent to their use for information about the event or training you have registered for, as well as for future invitations to similar events or technology-related news (sent no more than once a month). You can unsubscribe from our newsletters at any time.

Thanks for reading and accepting Privacy policy & Infotrust statement

Get data analytics news into your inbox

Infotrust team once a month shares BI news, products updates, technology trends and invitations to events and trainings. Mark your interests: