- Home
- /
- What’s new in Qlik Cloud: 2023 December
Learn about the new features and improvements in the following product areas:
Qlik Cloud Tabular Reporting
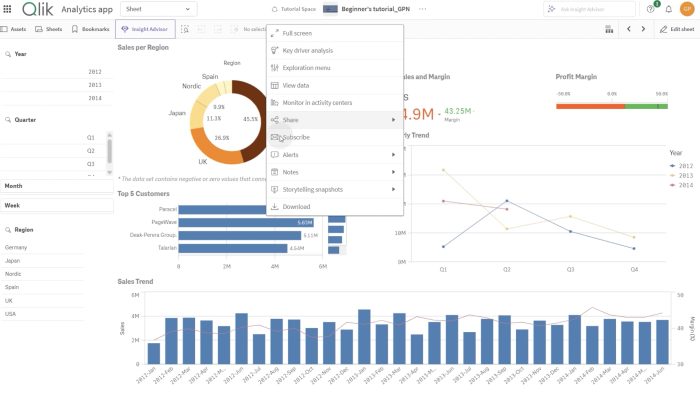
Now Qlik Cloud customers can address common, centrally managed, tabular report distribution requirements. Report developers can create custom, highly formatted, XLS documents from Qlikdata and Qlik visualizations. Governed Report Tasks can burst reports to any stakeholder ensuring that the Qlik platform is the source for operational decisions, customer communications and more. Read more on our colleague’s Maris Svilans blog post here.
New Pivot table
The new Pivot table is here with a set of new features:
All of the above are designed and added based on feedback from our users. The new Pivot table is launched in the Visualization bundle and will replace native pivot next year when additional features are added.
Styling Grid, Funnel & Sankey charts
The Grid chart, Funnel chart, and the Sankey chart have been upgraded with the new property panel for styling. The styling includes general settings for title, subtitle, footnote, background, border and shadow and chart specific settings for axis and value labels.
Filter pane styling
The Filter pane now gets more properties for styling: General settings for title font styling, background, border and shadow. Chart specific styling for header and content font styling, color settings for selection state, background color and image.
The Layout container
This is a new component in the Dashboard bundle. In the Layout container, charts can be placed in a freeform manner with or without a snapping grid. Charts can overlap, be stacked, and controlled with show conditions. The Layout container is highly versatile but especially useful for:
Borders and shadows
As of today, most charts receive settings for borders and shadows. Charts inherit the border setting from the theme but the border width and color setting can now be overridden and customized per chart. The border can play a big role in how your dashboard is perceived, use it wisely to achieve your goals.Chart shadow is a new property on charts, providing a shadow contour around the chart, with options for size and color. Shadows create a depth effect and can be used to highlight and make certain elements stand out.
Borders and shadows works very well in the Layout container where charts can overlap and be stacked.
Introducing Qlik conversational analytics in Microsoft Teams
Read more on a blog post by our colleague Maris Svilans here>
Additional SaaS application connectors.
Qlik is continuing to expand the connectivity of Qlik Cloud Data Integration with a new group of connectors that just got released. These connectors will enable you to gather business data from more applications that focus on the supply chain, ERP, CRM, and finance:
Qlik also updated the existing Oracle OPERA connector to support change data capture.
Similar to Qlik previous connector releases, these connectors are Generally Available (GA), covered by Qlik standard support policies and are tagged as Preview. If you haven’t already done so, you will need to contact your local support representative to activate the feature flag that enables all of these connectors in your tenant. The preview tag and feature flag are there because these connectors do not cover all use cases and we want to make sure you have the best experience possible.
Exporting and importing replication projects
Qlik has expanded the Export / Import project capability to support the new Replication projects. This adds the ability to move projects between different environments such as DTAP processes, as you could already do for Pipeline projects.
Registering data loaded by Stitch
Qlik Cloud Data Integration users can now seamlessly bring in data landed by Stitch into Qlik data projects and utilize Qlik data transformation services on this data. New UI options allow Qlik users to choose settings such as the watermark column and soft deletions when registering incremental data ingested by Stitch. These settings tweak the generated SQL based on the choices selected and optimize transformation processing time and cost.
Monitor views: Lineage and impact filtering.
Monitor views now provides more granular views into tasks. You now have the ability to filter tasks within a data pipeline, based on impact analysis or pipeline lineage.
These filters can be saved as part of a Monitor view definition. Within these filtered views, it is possible to do further filtering by errors as an example, to analyze how a task error impacts upstream or downstream data pipeline components.
Qlik Cloud Data Integration: Support for three new replication targets.
Qlik launched the ability to replicate data directly from supported data sources to an on-premises or cloud-based SQL Server.
This release extends that capability by introducing support for three new targets:
OpenAI Chat Completion block
The new Chat Completion block in the OpenAI connector in Qlik Application Automation brings support for OpenAI’s powerful GPT models which you can now use to run prompts against. You can use this block when distributing email reports to generate custom messages that are tailored to the recipient and certain KPIs from the app that are shown in the report.
Amazon Bedrock connector
The Amazon Bedrock connector in Qlik Application Automation enables your automation to interact with any of the text and image models from Bedrock and send the model’s output to any other automation connector or use it as input for another Bedrock model. You can for example use the text models to process support incidents from tools like ServiceNow or Salesforce and generate tailored responses which you can then surface to your support team by writing them back to the respective support tool or sending them directly to your support team over Slack or Microsoft Teams


June 18, 2025
3 min