- Home
- /
- Qlik Cloud April 2026: what’s new

The April release of Qlik Cloud introduces powerful enhancements across analytics, data management, automation, and user experience. From faster QlikView to Qlik Sense migrations to improved table styling, expanded automation capabilities, and enhanced AI-driven insights with Qlik Answers, this update helps organizations work more efficiently while unlocking deeper value from their data.
DATA ANALYTICS
Bidirectional glossary term relationships
When you define a relationship between two glossary terms, the inverse relationship now automatically appears on the related term as well. For example, if you relate Active Customer to Customer using the Is a relationship type, Customer will now display Has subtype: Active Customer — without any additional steps.
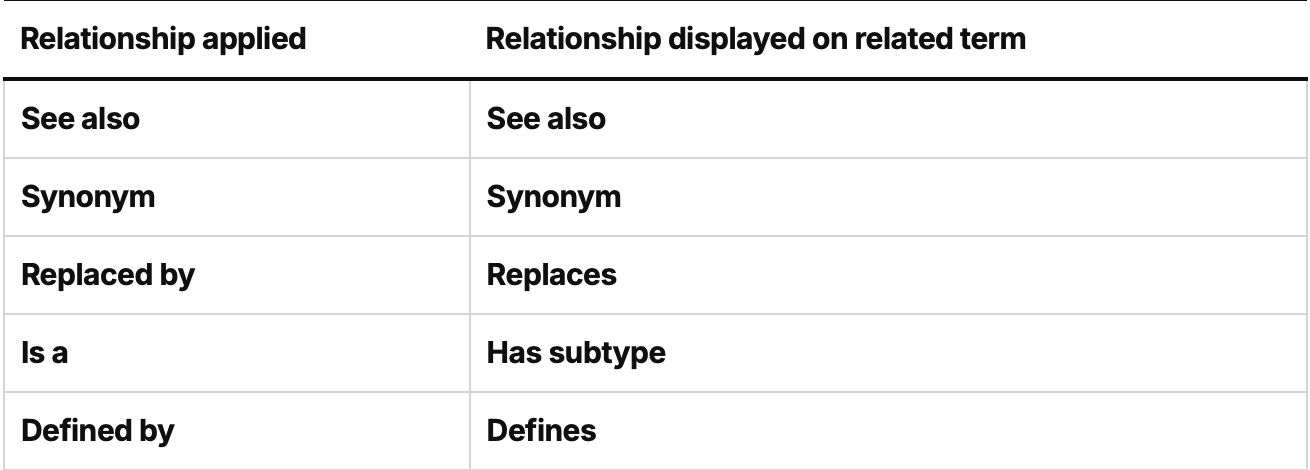
Previously, term relationships were only visible on the term where they were applied. With this update, stewards get a complete and consistent view of how terms relate to one another across the glossary, reducing the need to manually maintain relationships on both sides.
Improved error messaging for time series experiments
When a time series experiment fails, customers now get specific, actionable error messages instead of generic failures. Errors identify exactly which groups, columns, or time periods caused the issue and explain how to fix it. This directly reduces support escalations and lets users resolve data problems on their own — no ticket required.
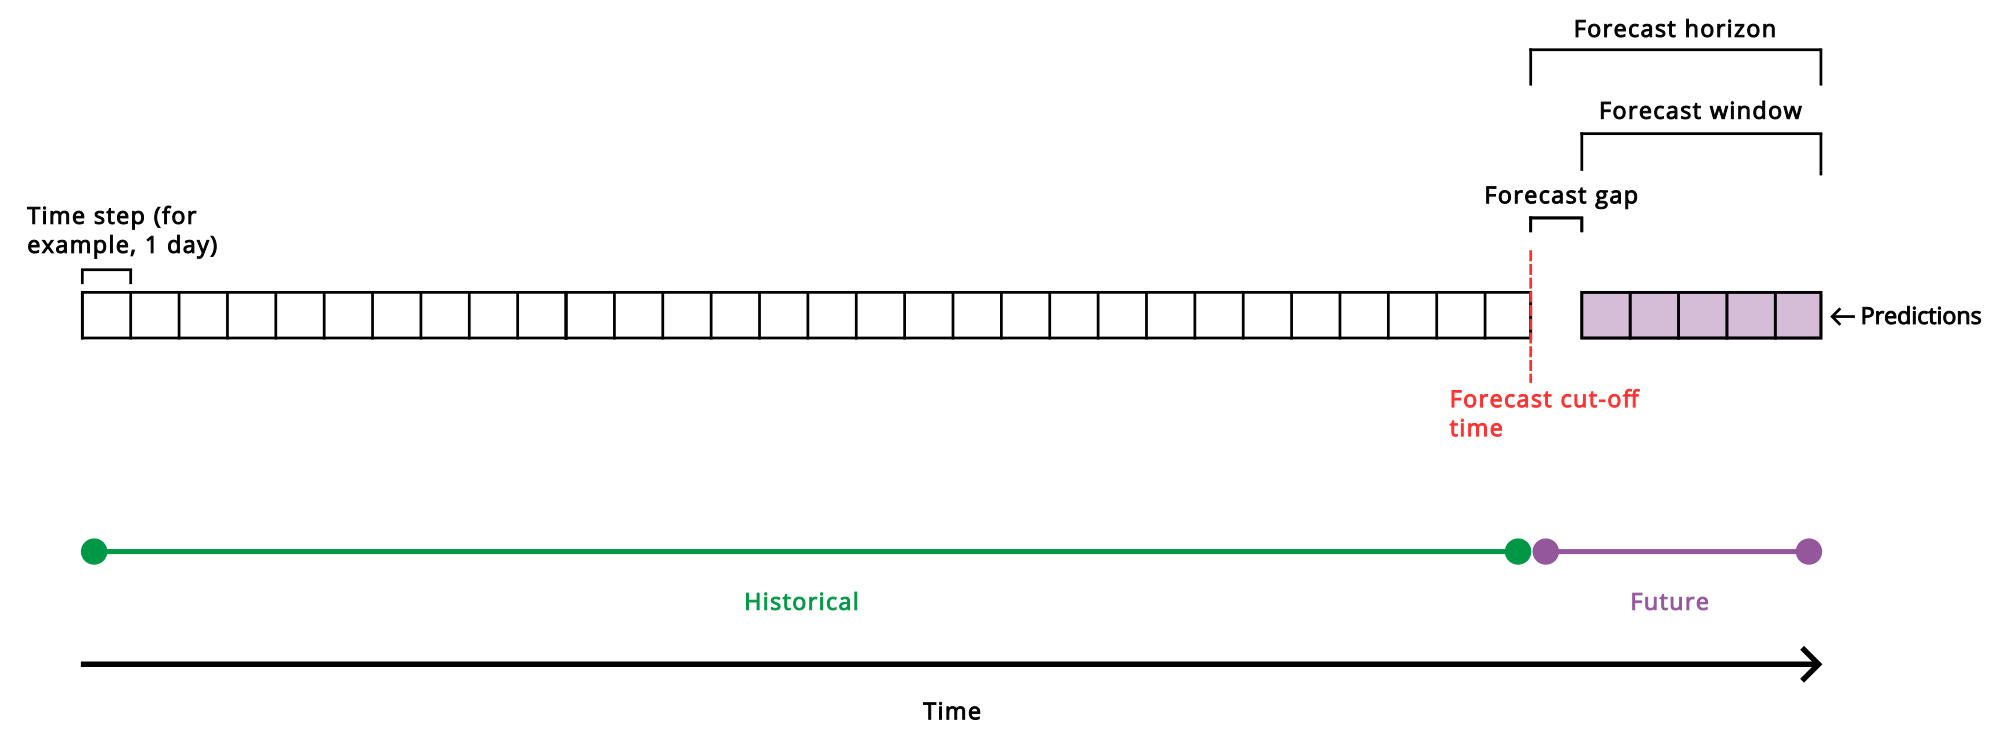
Working with multivariate time series forecasting
New bookmark and master item tools for Qlik MCP server
New Qlik MCP tools have been added, allowing you to:
Select by visible points in map charts
You can now configure your map charts to make selections in your application based on the visible points from a field. The new Spatial index operation in GeoOperations indexes your point data for use with your map chart. As you move focus in the map chart, selections are made from your selected point data field. Auto select visible makes it possible to display and interact with large map layers that would otherwise be too large to render.
Setting the zoom and selection behavior for maps
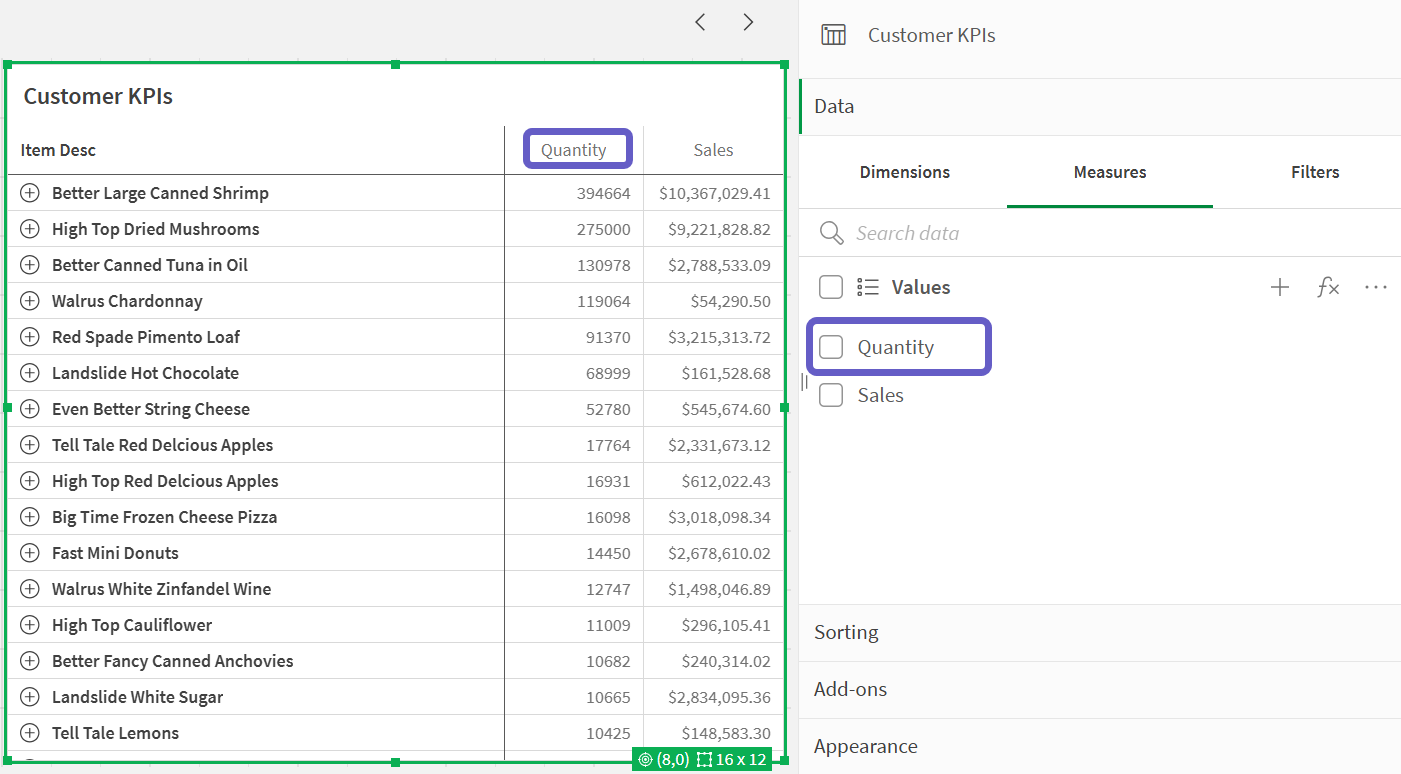
Pivot table exploration
The much long awaited table exploration has arrived for the new Pivot table. Enjoy the ability to move dimensions and measures between rows and columns as a view user. Just as with the Straight table the developer can set up alternative dimensions and measures so that the end user can pick and choose to create his own custom report. The data section has the new look feel with single panel for both current and alternative items.
Faster responses in Qlik Answers
Qlik Answers now delivers responses more quickly through an updated agent architecture. For structured data responses, the Semantic Search Agent and Chart Generation Agent are no longer shown as separate steps. These capabilities are now handled directly by the Data Analyst Agent, which works together with the Answers Agent to resolve your question in a single, unified flow. Complex questions involving comparisons, multiple measures, or specific time periods benefit the most from this update. No action is required to use the updated experience.
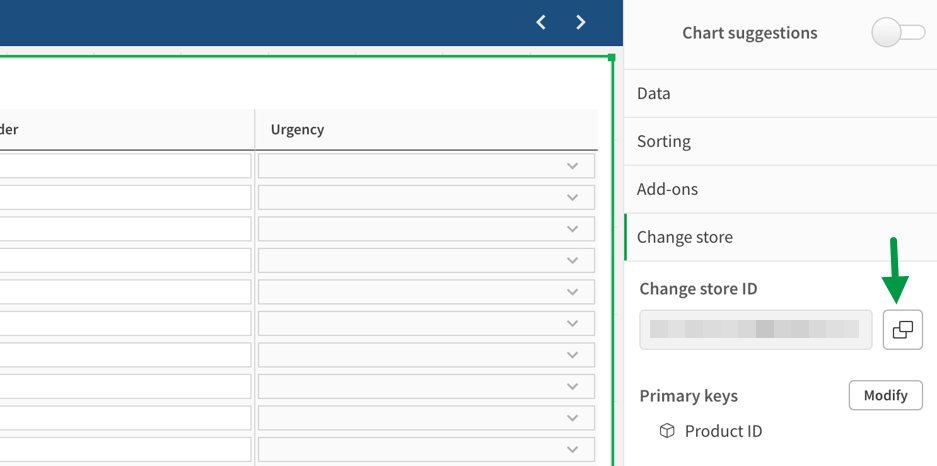
Support for expressions and label|value input for the write table dropdown input
The dropdown input type (single select) in the Write Table is now updated to support Qlik expressions to source options. It is also possible to use label/value pairs by separating them with a pipe symbol “|”.
QlikView to Qlik Sense Converter Tool (QV2QS) now available
QV2QS performs automated 1:1 conversion of QlikView application UIs directly to Qlik Cloud, giving you immediate access to Qlik Answers, Qlik Predict, MCP, Qlik Automate, Qlik Alerting, and the Qlik Reporting Service.
QV2QS converts the full consumption layer (sheets, layout, visualizations, and expressions), delivering a near-production-ready consumption experience in under five minutes per app. 25+ object types convert with full layout preservation, including charts, tables, containers, filters, buttons, text objects, conditional logic, alternate states, and background images. Your end users see the same dashboards they already know on day one. Convert apps individually or in batch to compress multi-month migration programs into days.
Convert now and immediately begin realizing value with AI, without the tedious manual recreation.
QV2QS is available at no cost on the Qlik Downloads page as a single Windows executable with no installer.
Straight table data section revamp
The data section in the Straight table has the new look feel with single panel for both current and alternative columns. That makes everything easier and also keeps the order intact for your hidden columns when you add more columns. The panel also makes it possible to show or hide multiple columns at the same time.
Select a branch for cross-project data sources
When consuming data from another project in a transform or data mart task, you can now select which version control branch of the referenced project to use as the source. The default branch is main. This lets you build stable prod-to-prod pipelines and isolated dev-to-dev pipelines across projects under version control.
Building cross-project pipelines

Qlik Talend Cloud – Data Integration improvements
Customers who are using Qlik Data Gateway – Data Movement need to upgrade to 2025.11.40 or later to benefit from these improvements. For upgrade instructions and a list of resolved issues, see Upgrading the Data Movement gateway installation.
Databricks driver rebranding
To align with Databricks, the driver for working with the Databricks connector has been rebranded.
Note: To prevent tasks from failing, customers working with the Databricks connector must upgrade their driver. You can do this automatically using the driver setup utility (recommended) or manually. For instructions, see Driver setup. If you choose to install the driver manually, make sure to edit the odbcinst.ini file according to the instructions.
Support for new Snowflake and Google BigQuery driver versions
This version introduces support for the following driver versions:
Support for the Databricks VARIANT data type
From this version, the following data types will be mapped to the Databricks native VARIANT data type:
Note: Requires Databricks Runtime 15.4 or later
Trigger data quality refresh for a data product
You can now trigger a full data quality refresh for all datasets within a data product in a single action.
What’s available
This release introduces on-demand data quality refresh at the data product level:
Why this matters
Data quality results can become stale as source data evolves. This update gives data product owners and quality leads a fast, centralized way to ensure quality scores and validation results reflect the latest data.
Computing data quality for data products
Ability to keep tasks artifacts after deletion
When deleting projects or tasks, you will now be asked if you want to keep task artifacts (tables and views) in the target platform. This applies to all tasks except landing and replication tasks.
Creating a data pipeline project
……. … ………… ….
Any questions please contact our consultants. Responding in one working day.