- Home
- /
- Qlik Cloud September 2026: what’s new
 Reading time: 20 min
Discover the latest Qlik Cloud release highlights, from improvements in Qlik Answers and AI optimization to new ways to organize analytics content, write scripts, and visualize task dependencies. This video covers Semantic Understanding, Fast and Thinking modes, new Qlik MCP tools, AI-created automations, and visual content indexing in PDFs. Explore Feature Preview, Pages, new application themes, customizable scatter plot heatmaps, performance evaluation options, expanded Global Search, and the next-generation script editor.
ANALYTICS
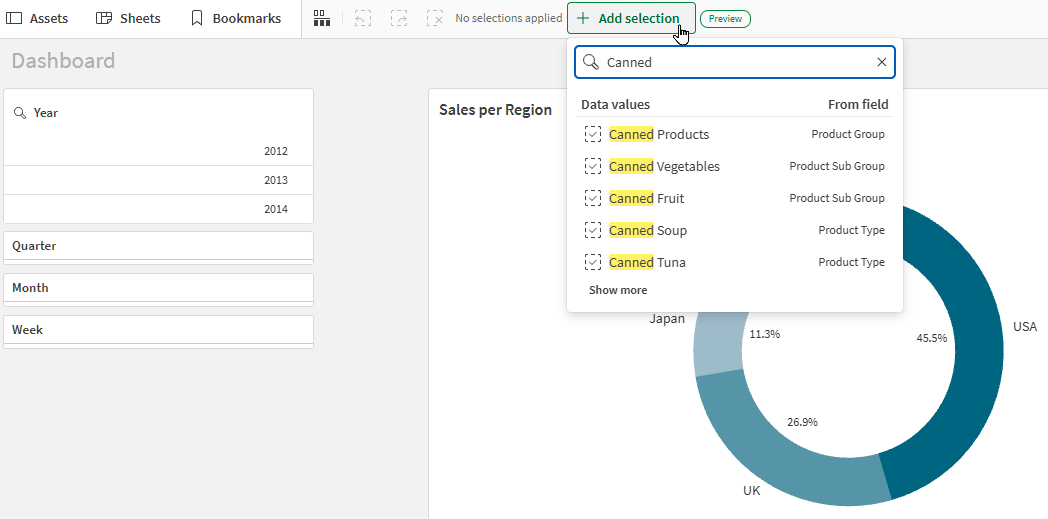
We’re making it easier for new users to begin making selections. The search icon in the selection bar is replaced with new button spurring users to get into the power of green white and gray. The Add to selection triggers a dropdown where users can search for dimensions, fields and values by typing. Try out the new functionality by turning it on in the Feature preview section.
Adding search results directly to your selection
Temporary compute engine overrides are now live in Application performance evaluation. Right from the evaluation screen, pick any engine size larger than what’s assigned (Large 40 up to Large 200) and run it once. No new permissions, no cost, no commitment: the override applies to that single run, then reverts automatically.
Every engine size is visible to every user, so you do not need a Large application capacity license to try one out. It’s the fastest way to know if a bigger engine is worth it before you make it permanent, and it stacks with existing recommendations for an even bigger jump. In one example, moving an application from Large-60 to Large-120 cut initial load time by 38%. Results will vary by application.
Application performance evaluation
Note: Now supported in Qlik Cloud Government. Now supported in Qlik Cloud Government – DoD.
Your AI assistant can now build automations that run on their own, not just ones you start by hand. Using the Qlik automation builder skill with the Qlik MCP server, describe when an automation should run, for example “every weekday at 7am”, and your assistant creates it with the schedule already in place. You can also ask for an automation that another tool should start, such as a Qlik Answers assistant, a sheet button or an AI agent, and your assistant sets it up to accept the values that caller sends.
Why it’s worth doing:
Good to know:
Qlik Agentic Skills repository
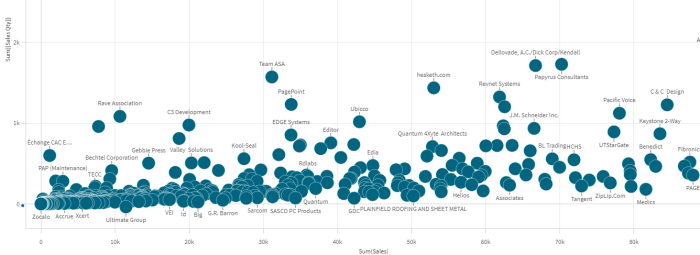
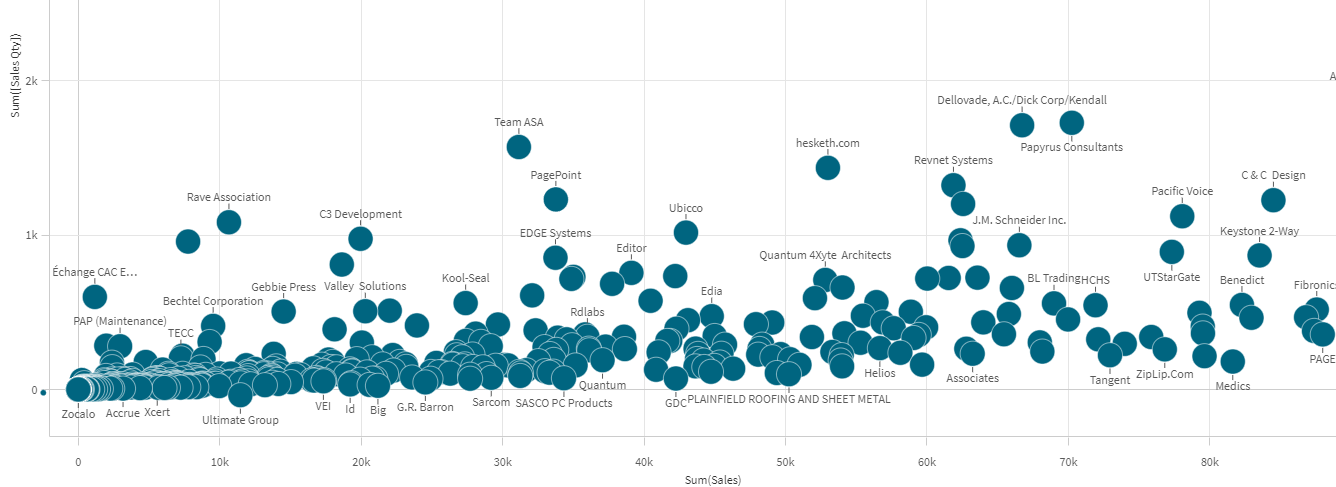
It’s now possible to set start and end color for the scatter plot heatmap, convenient when styling the app with colors. The scatter plot turns into a heatmap when the number of data points increases over a certain value. The heatmap intensity is relative to the amount of close points.
New Qlik MCP tools support the application and script lifecycle from your LLM client. You can create an application, inspect and update its load script, run a reload, and verify the results from status and logs. These tools support both guided authoring and automated workflows.
The new tools let you:
Customers with Qlik Cloud Analytics Enterprise subscriptions or Qlik Sense Enterprise SaaS can now establish an AWS PrivateLink endpoint between their data and their Qlik Cloud tenant using the Direct Access Gateway. This means data loaded to Qlik Analytics applications can be sent over a private network connection. For more information and configuration details, please see Configuring AWS PrivateLink for Qlik Data Gateway – Direct Access.
Note: Now supported in Qlik Cloud Government. Now supported in Qlik Cloud Government – DoD.
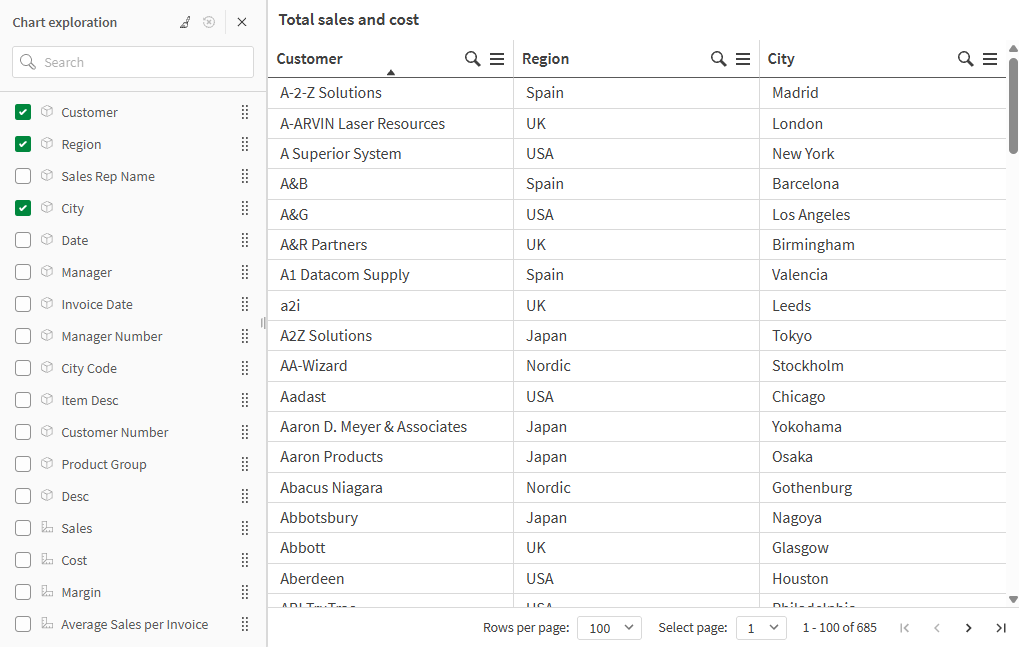
You no longer need to recreate your bookmarks when a table layout changes! New columns added to a straight table after your bookmark was saved will now be fully accessible under the chart exploration options.
You can now select between two modes when using Qlik Answers with assistants. Fast modedelivers quick responses to straightforward questions with rapid turnaround times, while Thinking mode provides deeper analysis for complex queries that require multi-step reasoning. Switch between modes at any point in your conversation to adjust the analysis depth based on your needs.
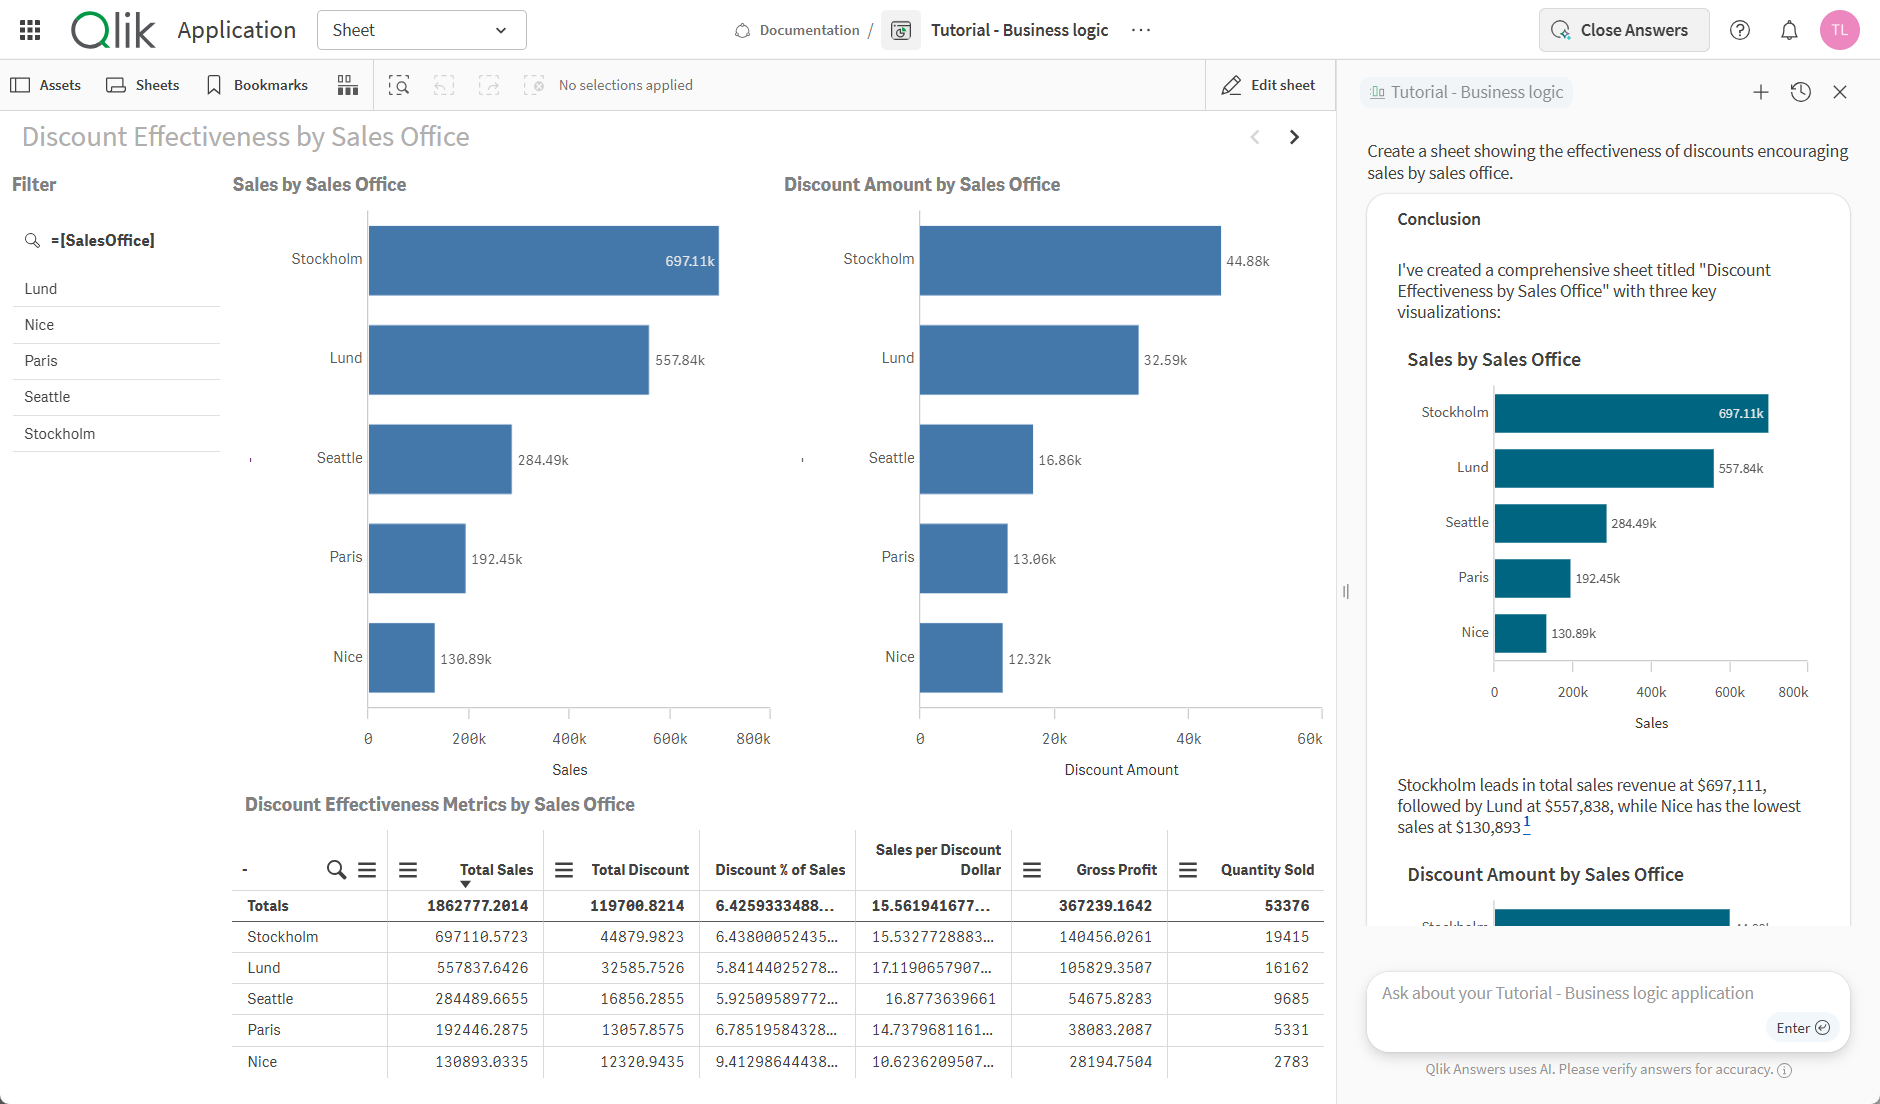
Understanding multi-step workflows just got a lot easier. With this release, you can now see your task dependencies visually — no more mentally mapping how scheduled tasks connect or digging through technical editors to piece it together.
This first phase introduces a tree-view chain visualization, purpose-built for the most common workflow pattern: sequential, dependent tasks. Once you’ve set up dependent tasks — like chaining a data pipeline step to an app reload — you can now see that chain laid out visually in a simple parent-child structure that’s easy to read at a glance.
What you can do:
What’s next: This is the first step in a broader rollout. A future phase will add advanced graph-based views supporting multiple upstream/downstream dependencies for more complex orchestration needs.
Viewing and managing task chains
When we introduced enhanced self-service scheduling in April 2025, we removed the When data is refreshed option, which had let reload schedules trigger automatically when a dependent dataset was updated. At the time, we weren’t able to carry that capability forward into the new task-based scheduler right away.
That capability is now returning. In the task editor, under Based on → Event, you can now select When data is refreshed to trigger a task automatically when a data update is detected in an upstream Qlik Talend Data Integration project that loads data into an analytics application.
This brings back the event-driven automation the old scheduler offered, now built natively into the new self-service scheduling framework — with full compatibility with the multi-task model.
Scheduling data refreshes with tasks
Applications now include two new themes: Foundation, the new default theme, and New Horizon, which applies Qlik brand colors. Visualization defaults have also been updated across combo charts, line charts, pie charts, filter panes, gauges, and KPIs.
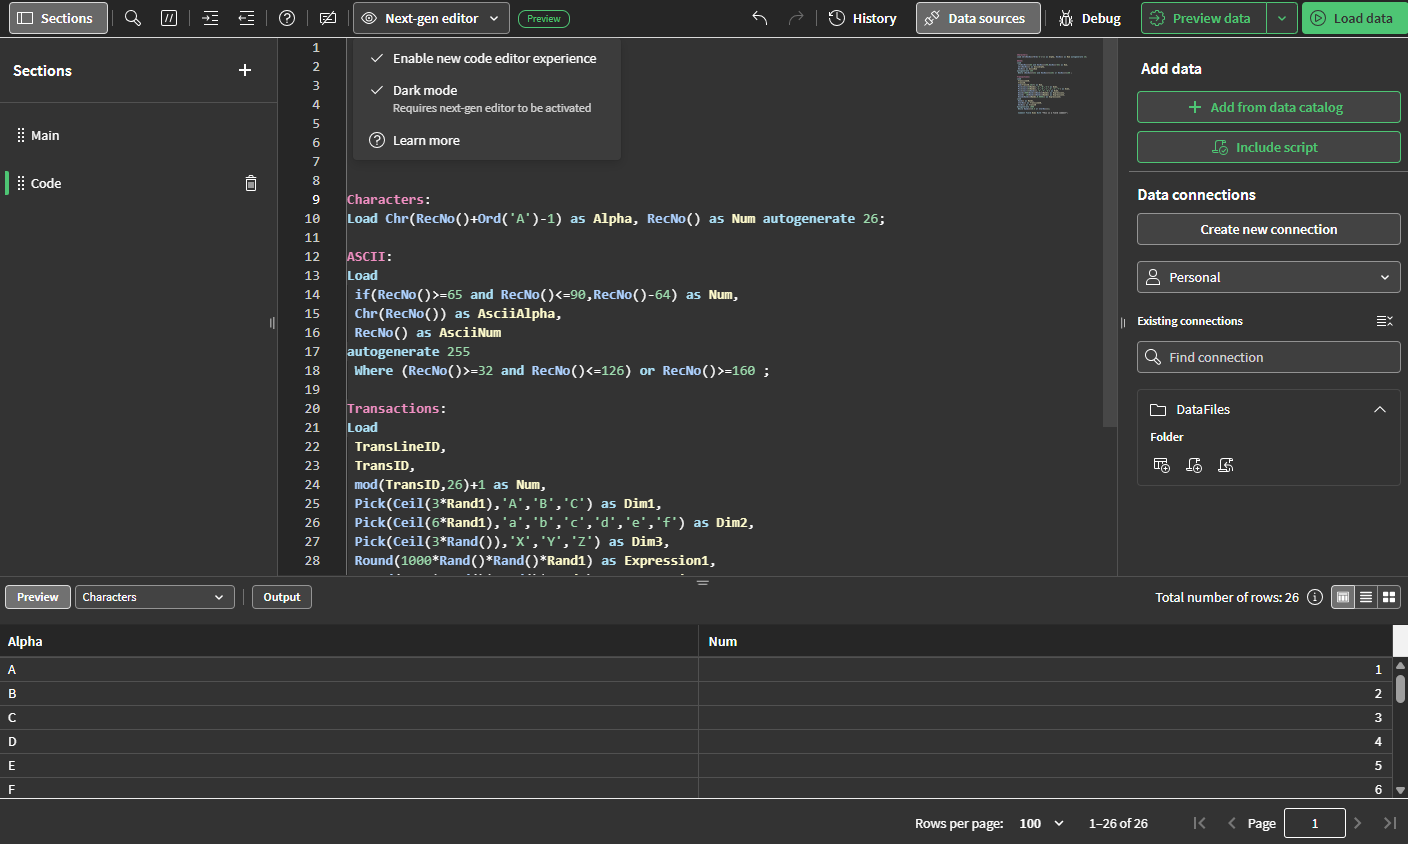
The Data load editor and Script editor now offer an IDE-grade editing experience for writing Qlik script in your applications and scripts. Activate it from your user profile under Feature preview. Once activated, you can switch back to the classic editor at any time from the Next-gen editor menu in the toolbar.
A number of keyboard shortcuts have been added or updated as part of this experience, see Keyboard shortcuts in Data load editor and Script.
These improvements are designed to bring a more productive, modern authoring experience to analytics developers who prepare and model data for analytics in Qlik Cloud.
For more information on activating preview features, see Feature preview.
Working with the next-gen script editor
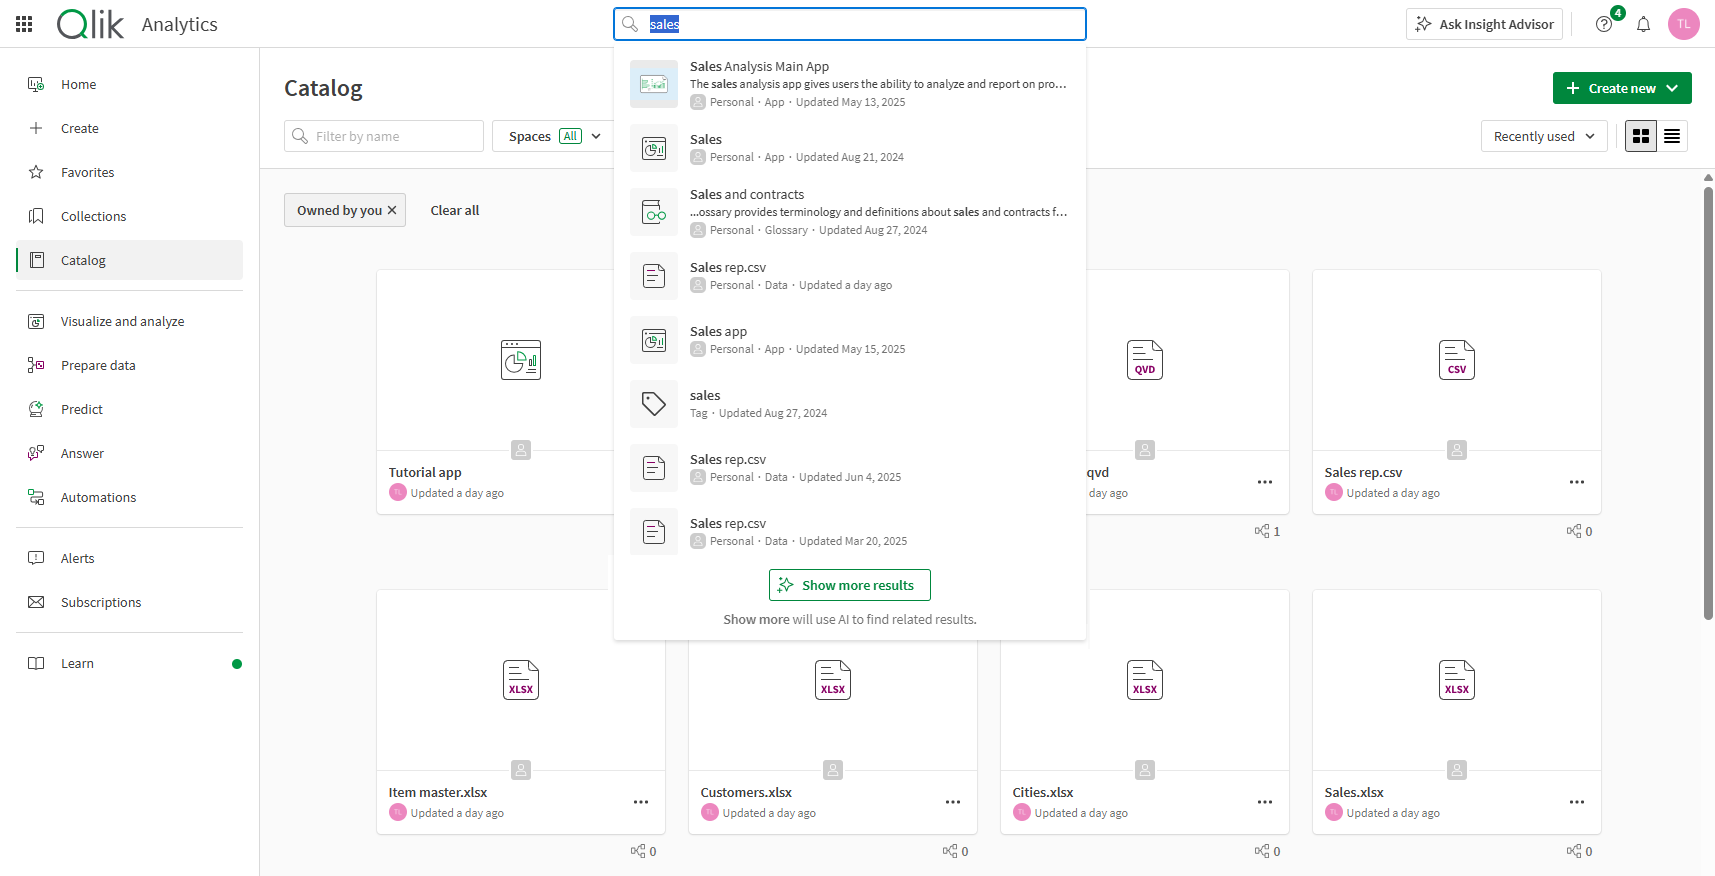
You can now, in global search, find content from your analytics applications, starting with sheets and bookmarks. Visualizations and master items are coming soon. You can also find results the terms and categories from your business glossaries.
Whether you remember a partial term, a concept, or something in a different language, search will surface the right application based on what’s inside it, not just its name.
You can now add comments directly to individual cells while you work on data issues in a sprint. Use comments to ask questions, add context, or point out data that you are unsure about, right where the issue is.
Other domain experts such as sprint owners and data stewards can add comments to the same cell or reply in the thread, so discussions about a data issue happen in the same place as the work to fix it.
With this release:
For details, see Working with cell comments in a resolution sprint
Data stewards are now notified automatically when their sprint assignments change, so they no longer have to wait for the sprint owner to tell them.
You receive a notification when:
Sprint owners no longer have to tell each data steward about these changes themselves.
For details, see Sprint notifications
You can now run data quality computation on files larger than 1 GB and up to 100 GB. Quality scores and Qlik Trust Score™ are available for large files registered in the catalog or included in a data product. They are calculated in the same way as for other files.
With this release:
Data quality for connection-based datasets
Data quality for uploaded files
API Contracts now includes new governance capabilities for teams that design, share, and publish APIs.
This brings three key benefits:
Working with multiple versions
Note: Not supported in Qlik Cloud Government. Not supported in Qlik Cloud Government – DoD.
Data contracts now support volume expectations. A volume expectation compares the record count of a dataset against a static baseline that you define.
Volume expectations use the same framework as the expectations introduced in the previous release.
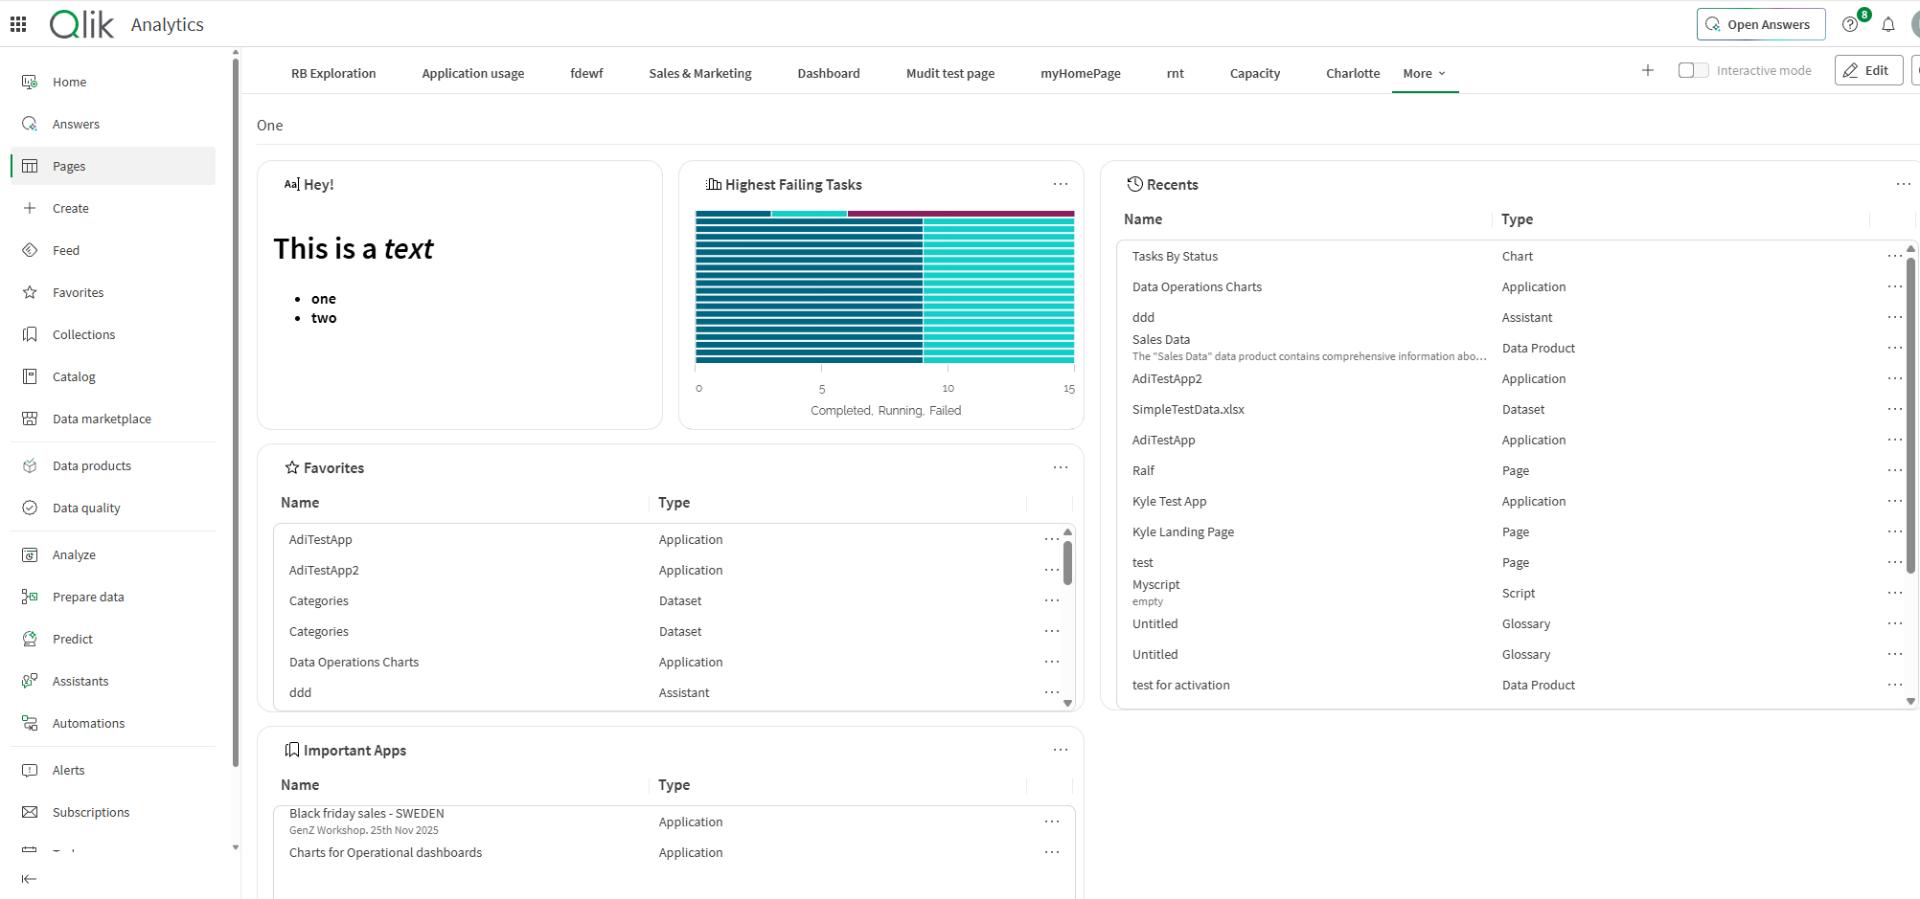
Pages lets you build a free-form, canvas-based landing experience instead of being limited to horizontal swimlanes of collections, either for yourself or for a group of users.
What you can do:
Please provide feedback via the feedback mechanism in the feature preview modal.
This is a public preview only; it is not generally available yet and is subject to change given your feedback.
You can now use date, time, and timestamp functions in validation rule expressions, directly from the rule builder, extending the same expression syntax already available for arithmetic and string/number operands.
What’s available
Users also benefit from inline expression validation with actionable error feedback before the rule is saved.
Updates in 2026:
Any questions please contact our consultants. Responding in one working day.